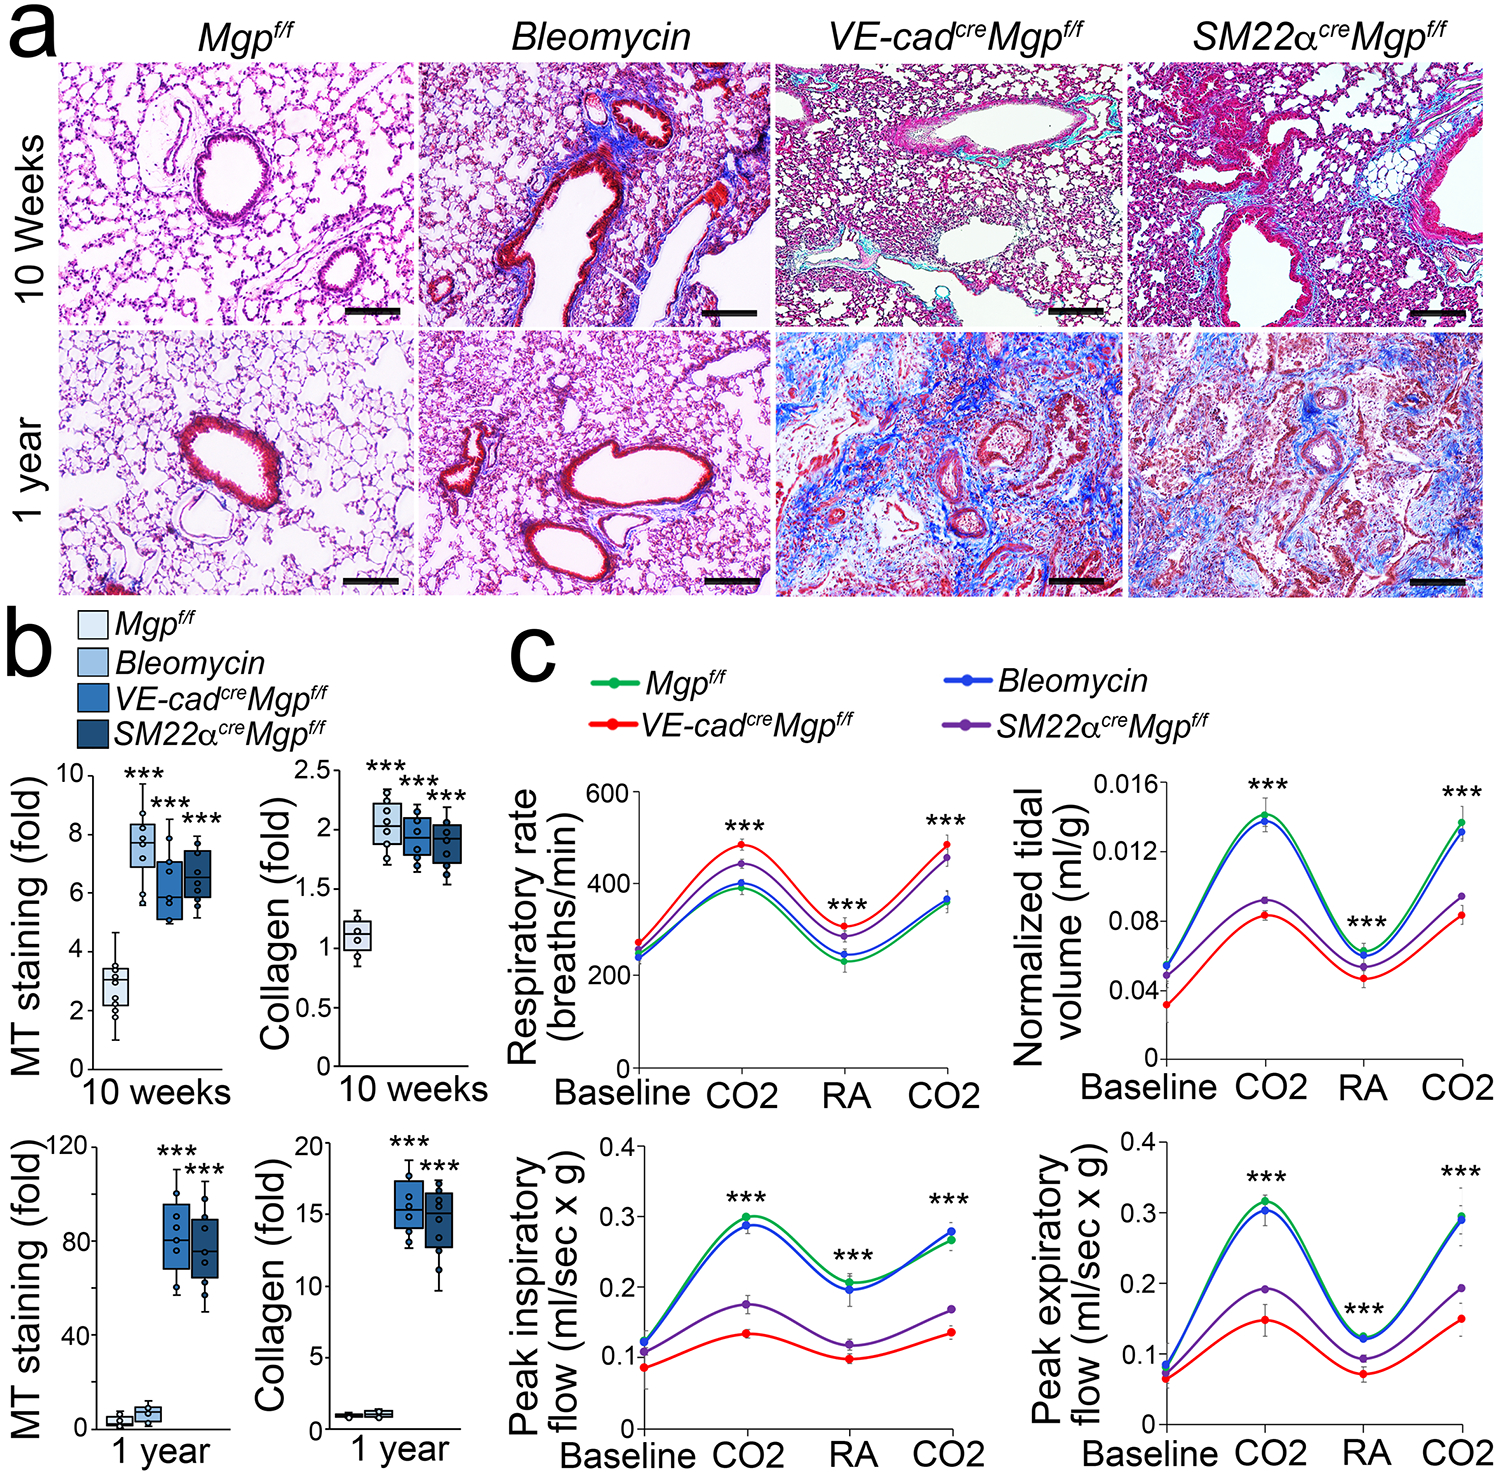
Figure 1. Pulmonary fibrosis in VE-cadherincreMgpflox/flox and Sm22αcreMgpflox/flox mice.

a, Masson’s trichrome (MT) staining of pulmonary tissues (n=10). f/f, flox/flox. Bleomycin, wild type mice injected with bleomycin. VE-cad, VE-cadherin. Scale bar, 100 μm.
b, Quantification of MT staining and collagen accumulation in pulmonary tissues (n=9).
c, Mouse pulmonary tests (n=6). CO2, hypercapnia phase with 7% CO2, 21% O2, and balanced N2. RA, room air.
b and c were analyzed for statistical significance by ANOVA with post hoc Tukey’s test. The bounds of the boxes are upper and lower quartiles with data points. The line in the box is the median. Error bars are maximal and minimal values (b). Error bars are mean ± standard deviation (SD)(c). ***, P<0.0001.
