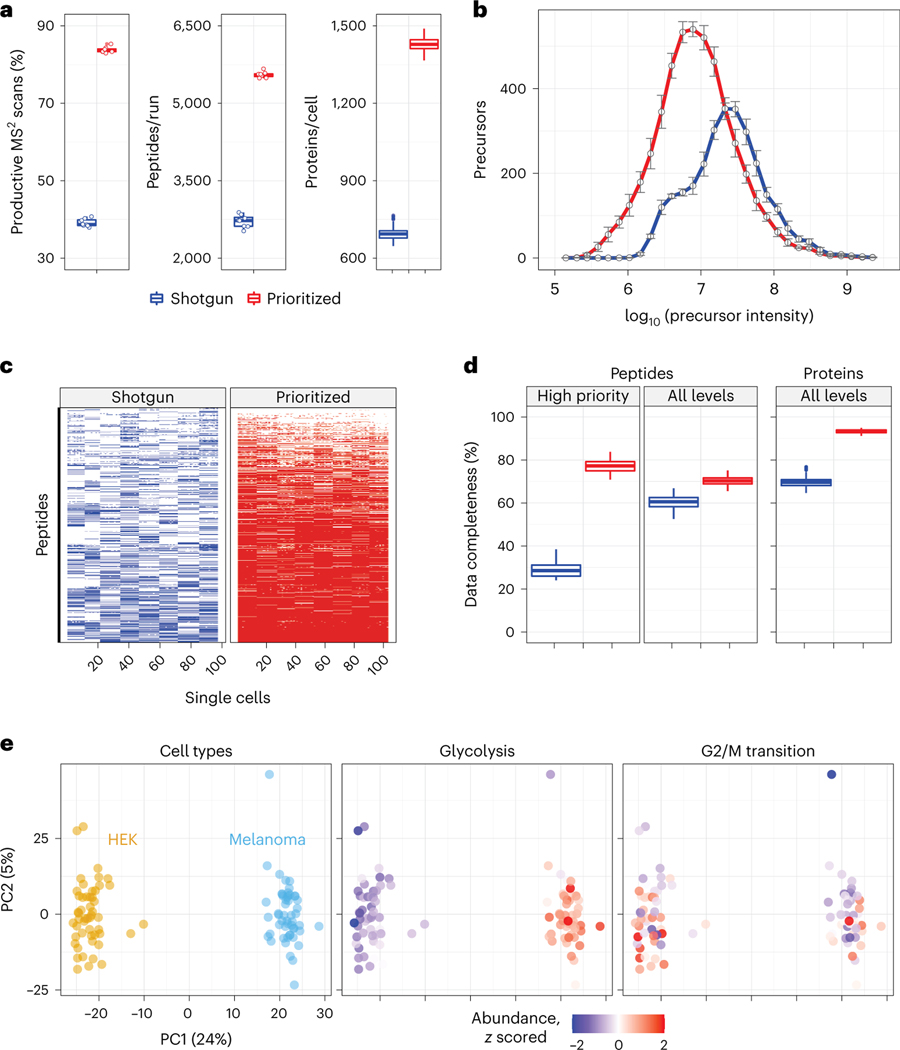
Fig. 2 |. Prioritization increases proteome coverage, sensitivity and data completeness of single-cell protein analysis.
a, Relative to shotgun analysis, prioritization increased the fraction of MS2 scans assigned to peptide sequences (n = 8 experiments per box plot), the number of peptides per run (60-min active gradient; n = 8 experiments per box plot) and the number of quantified proteins per single cell (n = 97 single cells per box plot). b, Prioritized analysis enables increased sensitivity and dynamic range while analyzing more peptides than shotgun analysis with matched parameters. n = 8 experiments per analysis method. Data are represented by the median, and error bars denote s.d. Precursor abundances stratified by priority level are displayed in Supplementary Fig. 1. c, A heatmap showing data completeness across single cells (columns) for 1,000 peptides (rows) from the top priority tier. d, Prioritized analysis increases data completeness at both peptide and protein levels across all priority tiers. n = 194 and 206 single cells analyzed by shotgun and prioritization, respectively. e, PCA of the single cells associated with b cluster by cell type. Protein sets enriched in the PCs are visualized by color coding the single cells by the median protein abundance of the set in each cell. All experiments used 60-min active gradients per run and 0.5-Th isolation windows for MS2 scans. All peptide and protein identifications were filtered at 1% FDR with additional filtration criteria detailed in Methods. For all box plots, whiskers display the minimum and maximum values within 1.5 times the interquartile range of the 25th and 75th percentiles, respectively; the 25th percentile, median and 75th percentile are also featured.

