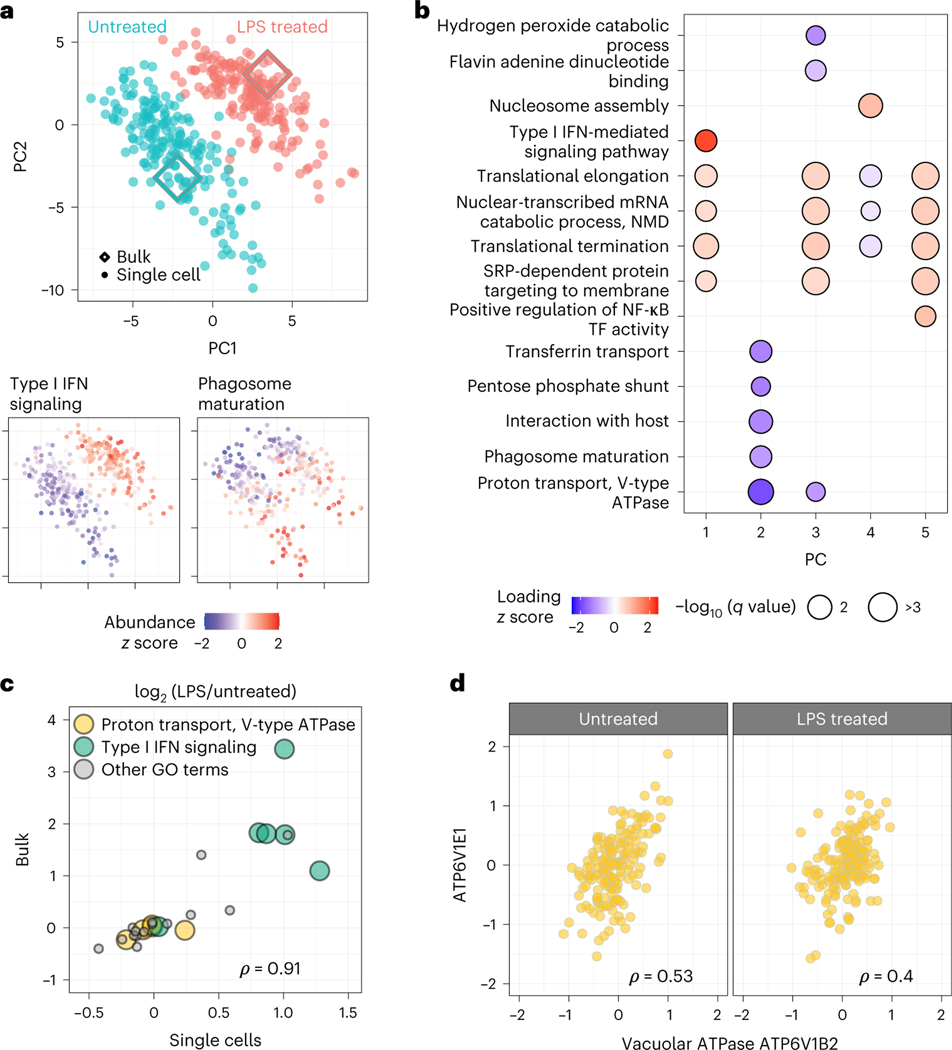
Fig. 4 |. Prioritized analysis of primary macrophages identifies protein variation within and across treatment conditions.
a, PCA of 373 BMDMs and 1,123 proteins color coded by treatment condition. Diamond markers indicate bulk samples projected in the same low-dimensional space as the single cells. The adjoining PCA plots are color coded by the z-scored median relative abundance of proteins corresponding to type I IFN-mediated signaling and phagosome maturation. Performing this analysis without imputation recapitulates these results, as shown in Extended Data Fig. 7. b, Protein groups identified by PSEA performed using the PC vectors with protein weights from the PCA shown in a. NF-κB, nuclear factor κB; TF, transcription factor; NMD, nonsense-mediated mRNA decay; SRP, signal recognition particle. c, The protein fold changes (LPS-treated/untreated macrophages) were estimated both from single cells and from bulk samples. The corresponding estimates correlate positively, with a Spearman correlation of ρ = 0.91 computed using all 28 proteins shown (P = 2 × 10⁻¹¹); all GO terms are labeled in Supplementary Fig. 2. d, Proteins functioning in proton transport do not change across conditions but covary within a condition (across 177 single cells). Correlations between all vacuolar ATPase proteins annotated with proton transport are displayed in Supplementary Fig. 3. In c and d, ρ denotes Spearman correlations, and all associated q values are <10−7.

