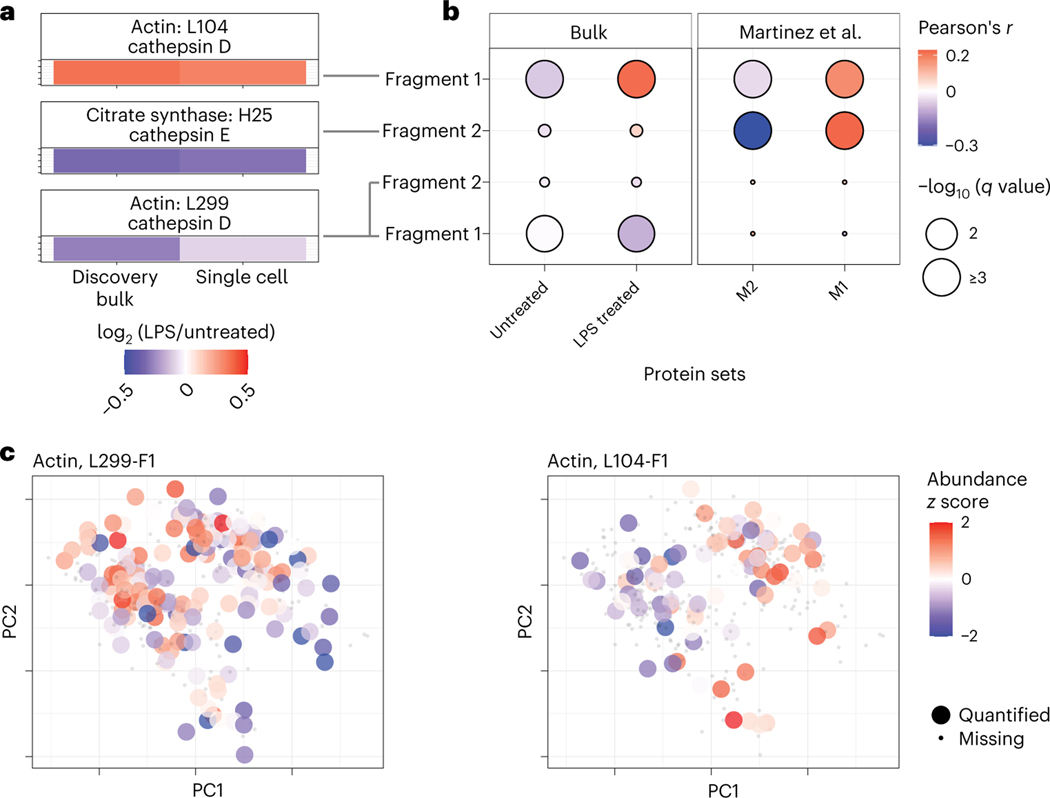
Fig. 6 |. Proteolytic products in individual macrophages correlate with inflammatory markers and vary within treatment groups.
a, A comparison between untreated and LPS-treated ratios of proteolytic products quantified in discovery bulk experiments and in single cells. Annotations are derived from the MEROPS database41. b, Correlation analysis of proteolytic products with treatment group-specific and macrophage-polarization-specific protein panels. c, Data from the untreated and LPS-treated cells were projected by PCA and color coded by the relative abundance of the indicated actin fragments.

