
Figure 4:
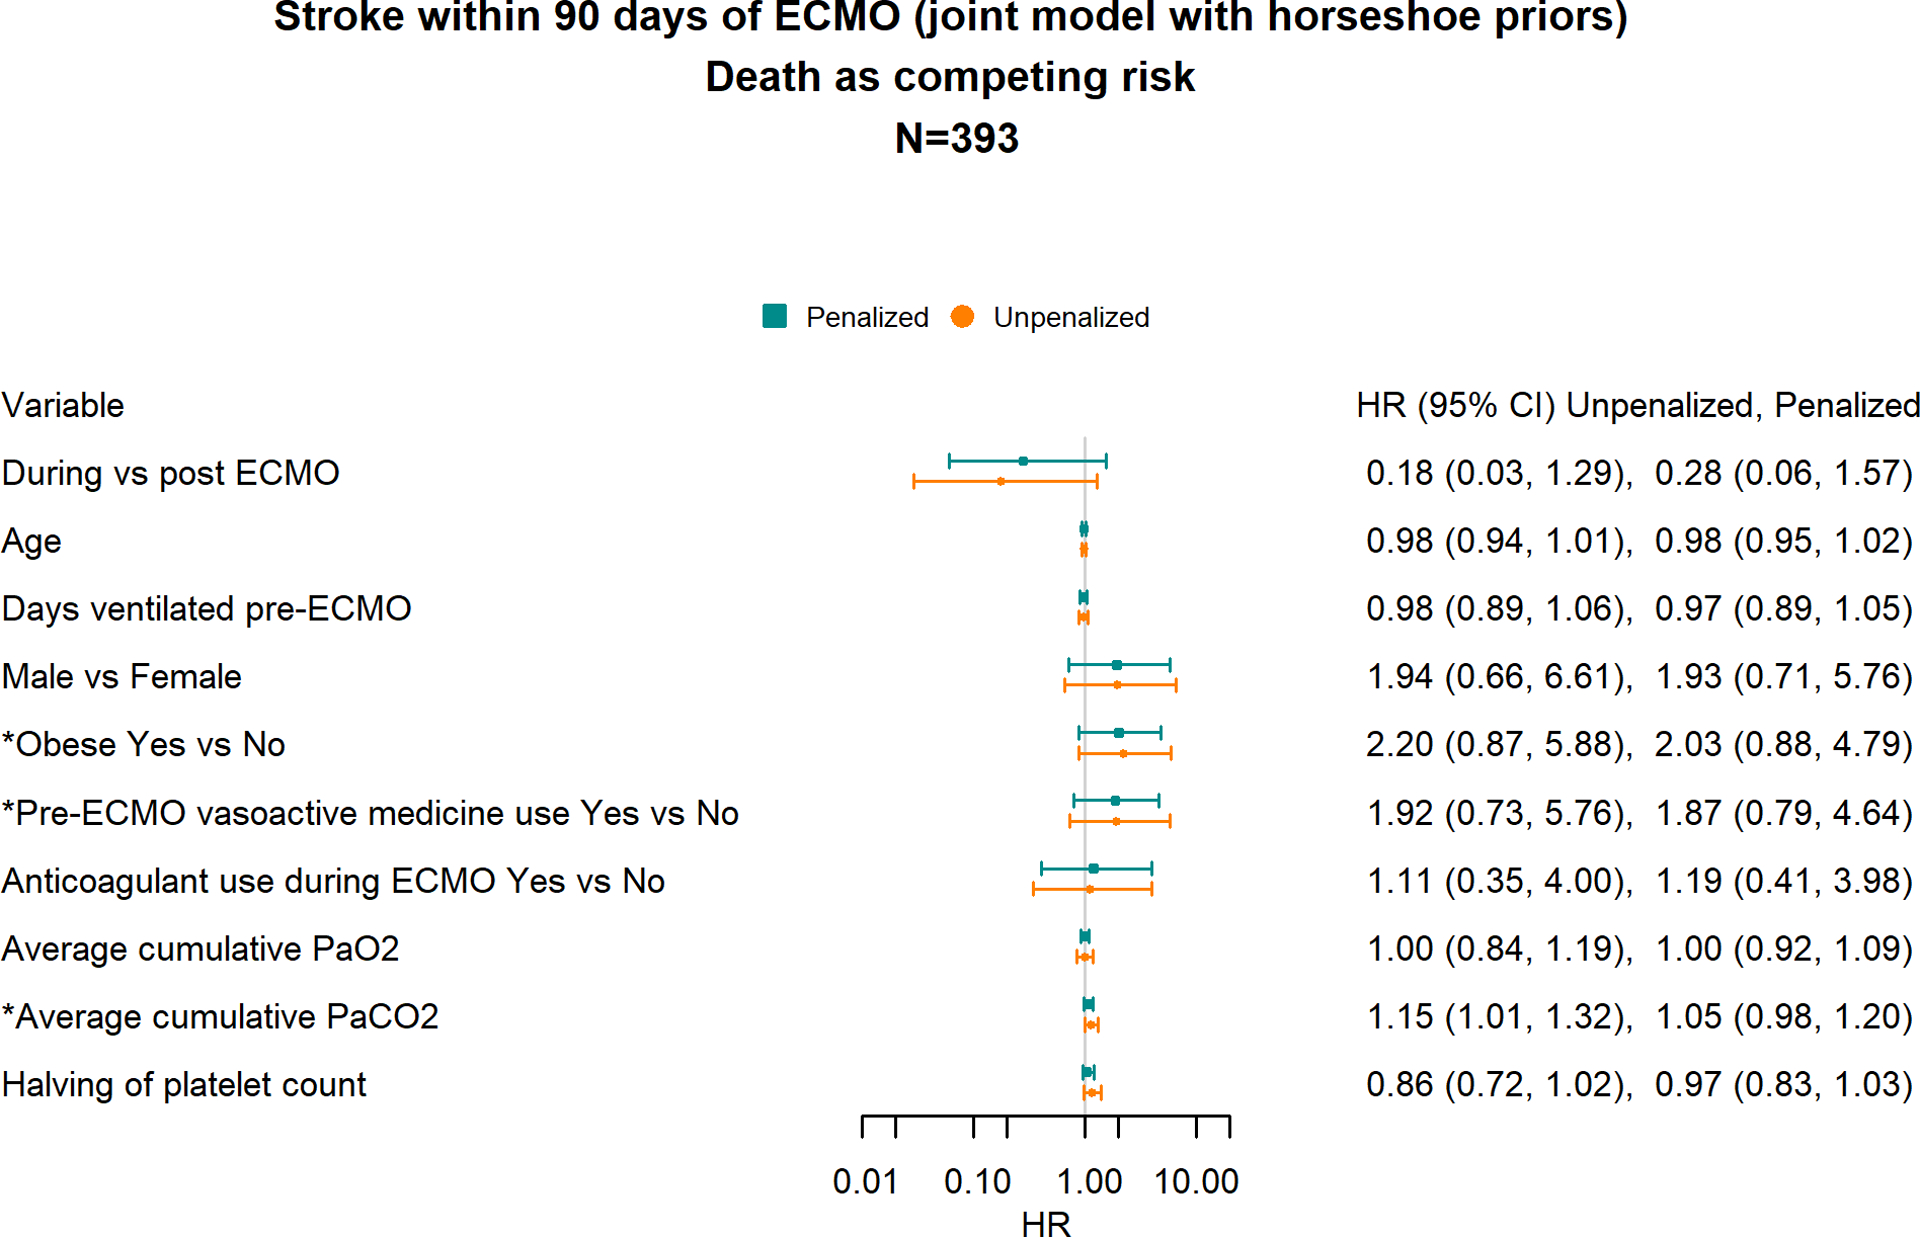
the unpenalized and penalized models, the best fitting model used horseshoe priors, followed by the unpenalized model, while the ridge priors had the worst fit. Hazard Ratios (HRs) for the best fitting model with horseshoe penalized model are provided for both stroke and death outcomes in the forestplot. The forestplot for penalized HRs with horseshoe priors, showed that the regression coefficients shrunk closer to the null and that all HRs for stroke now included 1.0, including PaCO2 for stroke. ECMO = extracorporeal membrane oxygenation, Average cumulative PaCO2 = the average PaCO2 during the ECMO support, Average cumulative PaO2 = the average PaCO2 during the ECMO support.