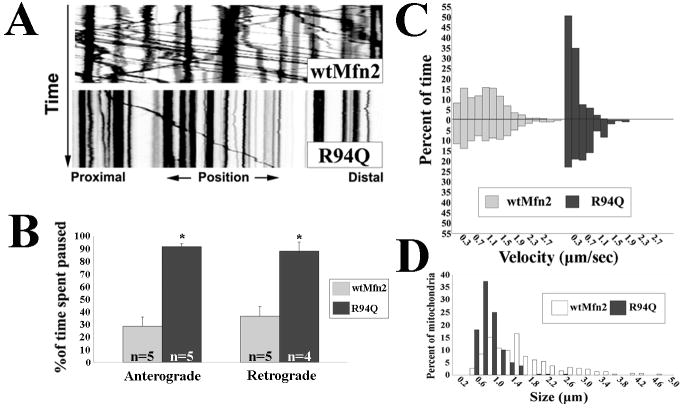
Figure 1. CMT2A associated Mfn2 mutants alter the transport of axonal mitochondria.
Mitochondria in cultured DRG neurons expressing wtMfn2 or R94Q were labeled with mito-RFP and imaged by time lapse microscopy. (A) Kymograph analysis of mitochondrial movements in R94Q expressing cells reveal diminished numbers of moving mitochondria. (B) Mitochondria from R94Q expressing neurons spent more time paused between anterograde and retrograde movements than did mitochondria from controls. (* = p<0.005, t-test; n= # of axons from which image stacks were created. Each condition contained a total of at least 500 observed mitochondria) (C) Velocity distributions representing the amount of time that mitochondria from wtMfn2 or R94Q expressing neurons spent moving at indicated velocities. Anterograde velocities are presented as positive values and retrograde movements as negative values. There was a shift in both the anterograde and retrograde velocity distributions of mitochondria from R94Q expressing neurons toward slower velocities. The differences were statistically significant as determined by Rank Sum test analysis (p<0.001). (D) Size frequency distributions of axonal mitochondria from wtMfn, R94Q and H361Y expressing cells show that CMT2A disease mutants decrease mitochondrial lengths.

