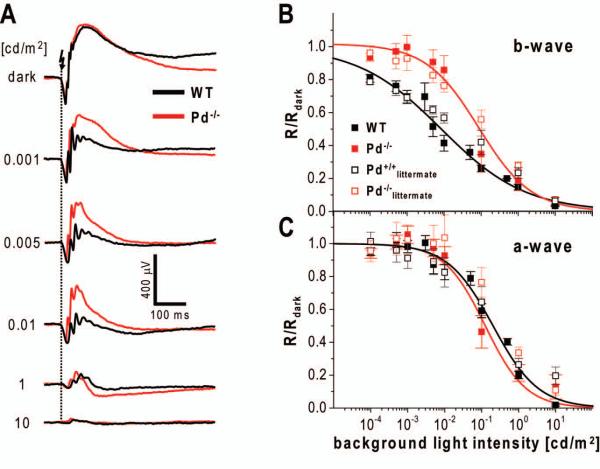
Figure 6.
Impaired light adaptation of ERG b-waves in Pd−/− mice probed with saturating flashes.
(A) Representative ERG responses in WT and Pd−/− mice evoked by a flash of 1 cd·s/m2 photoacivating ~200 rhodopsin molecules per rod. Up to 10 trials with inter-trial times of 15 s were averaged for each condition. Recordings were performed in the dark and after 2 min adaptation to background light of several luminances indicated to the left of the traces. The amplitudes of b-waves (B) and a-waves (C) were normalized to dark-adapted values (R/Rmax) and plotted as functions of background luminance. Closed symbols represent the data obtained from WT and Pd−/− mouse lines used in the rest of this study. The data are fitted using Equation 2 and plotted as solid lines. Open symbols represent the data obtained from WT (Pd+/+) and Pd−/− littermates. The parameters of all fits and the number of analyzed animals of each type are summarized in Table 4.

