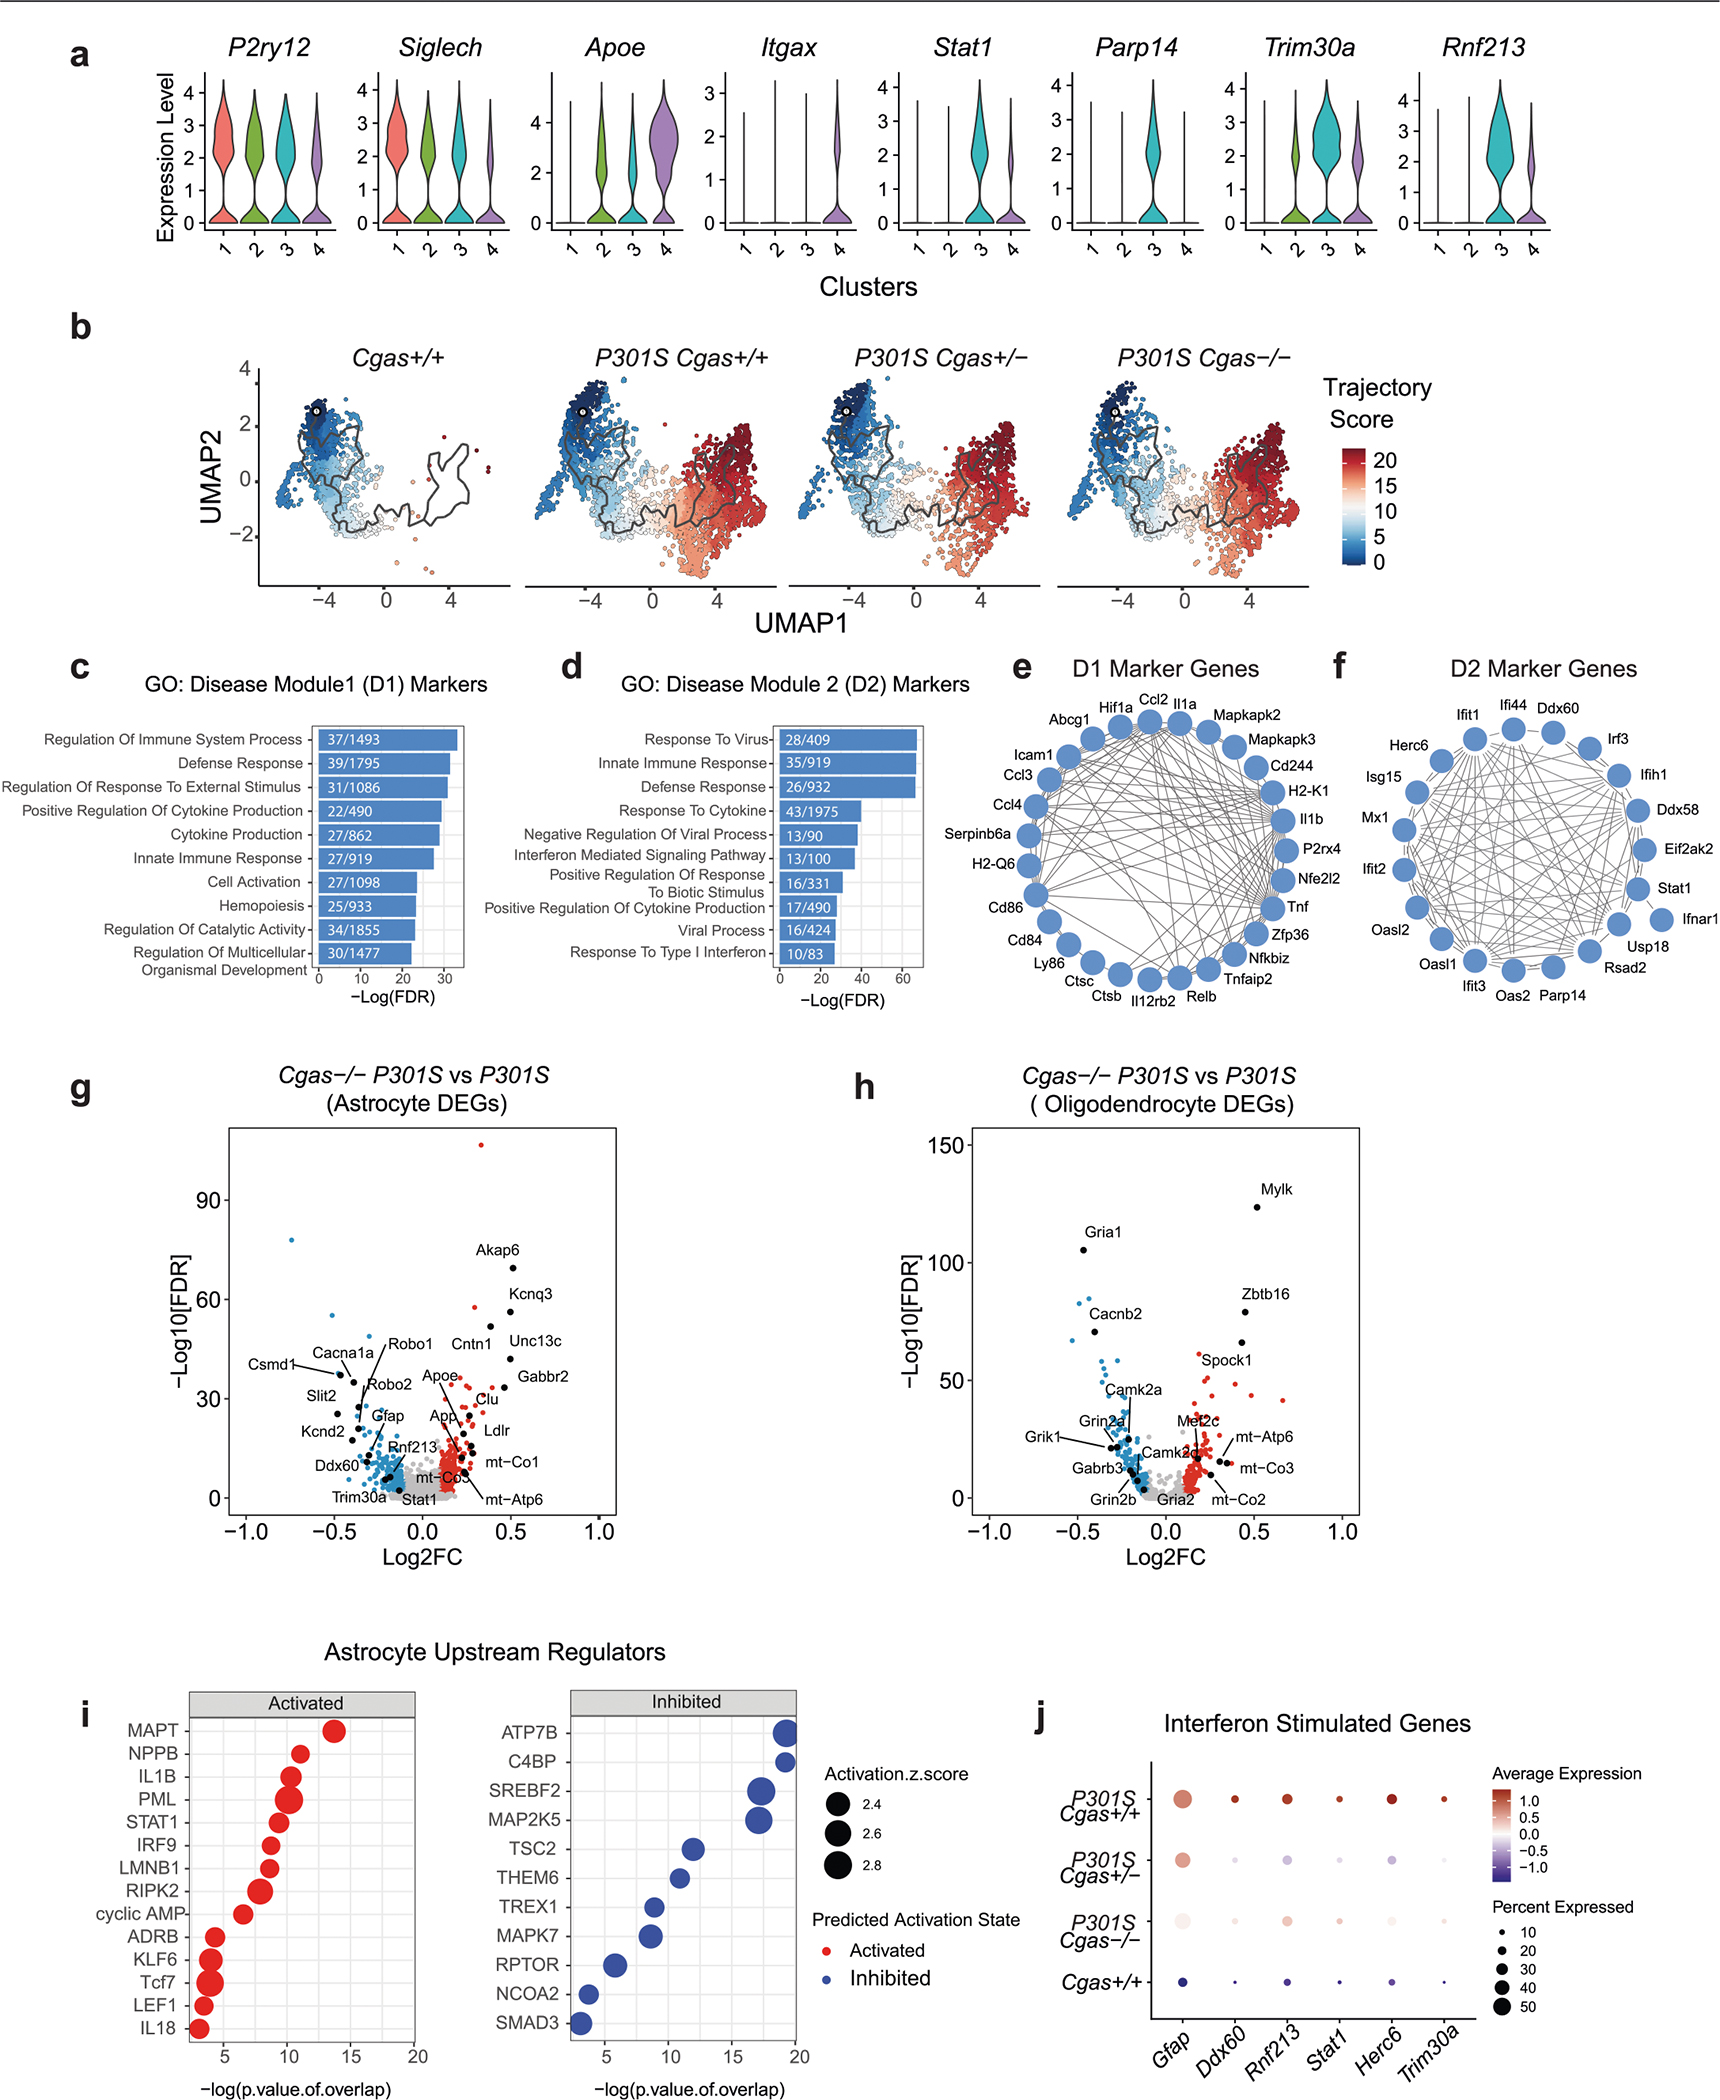
Extended Data Fig. 4 |. snRNA-seq analyses of microglia, astrocytes, and oligodendrocytes (Related to Fig. 3).

a. Violin plots showing expression level of homeostatic (P2ry12, Siglech), disease-associated (Apoe, Itgax) and interferon (Parp14, Stat1, Trim30a, Rnf213) genes in microglia clusters. b. Microglial trajectory plots colored by cell state trajectory scores identified using Monocle 3 and split by genotype. c. Top gene ontology terms enriched in disease module 1 markers. d. Top gene ontology terms enriched in disease module 2 markers. e. String interaction plot of disease module 1 markers. f. String interaction plot of disease module 2 markers. g. Volcano plot showing representative DEGs in P301S Cgas−/−, compared to P301S Cgas+/+ astrocytes. (logFC > =0.1 or < =−0.1, FDR < 0.05). h. Volcano plot showing representative DEGs in P301S Cgas−/−, compared to P301S Cgas+/+ oligodendrocytes. (logFC > = 0.1 or <=−0.1, FDR < 0.05). i. Predicted upstream regulators associated with DEGs in P301S Cgas−/−, compared to P301S Cgas+/+ astrocytes, from Ingenuity Pathway Analysis. P-value overlap < 0.05, Activation Z score > 2 or < −2. Right-tailed Fisher’s exact test. j. Dot plot showing interferon-stimulated genes that are significantly lower in P301S Cgas+/− and P301S Cgas−/− astrocytes than in P301S Cgas+/+ astrocytes.
