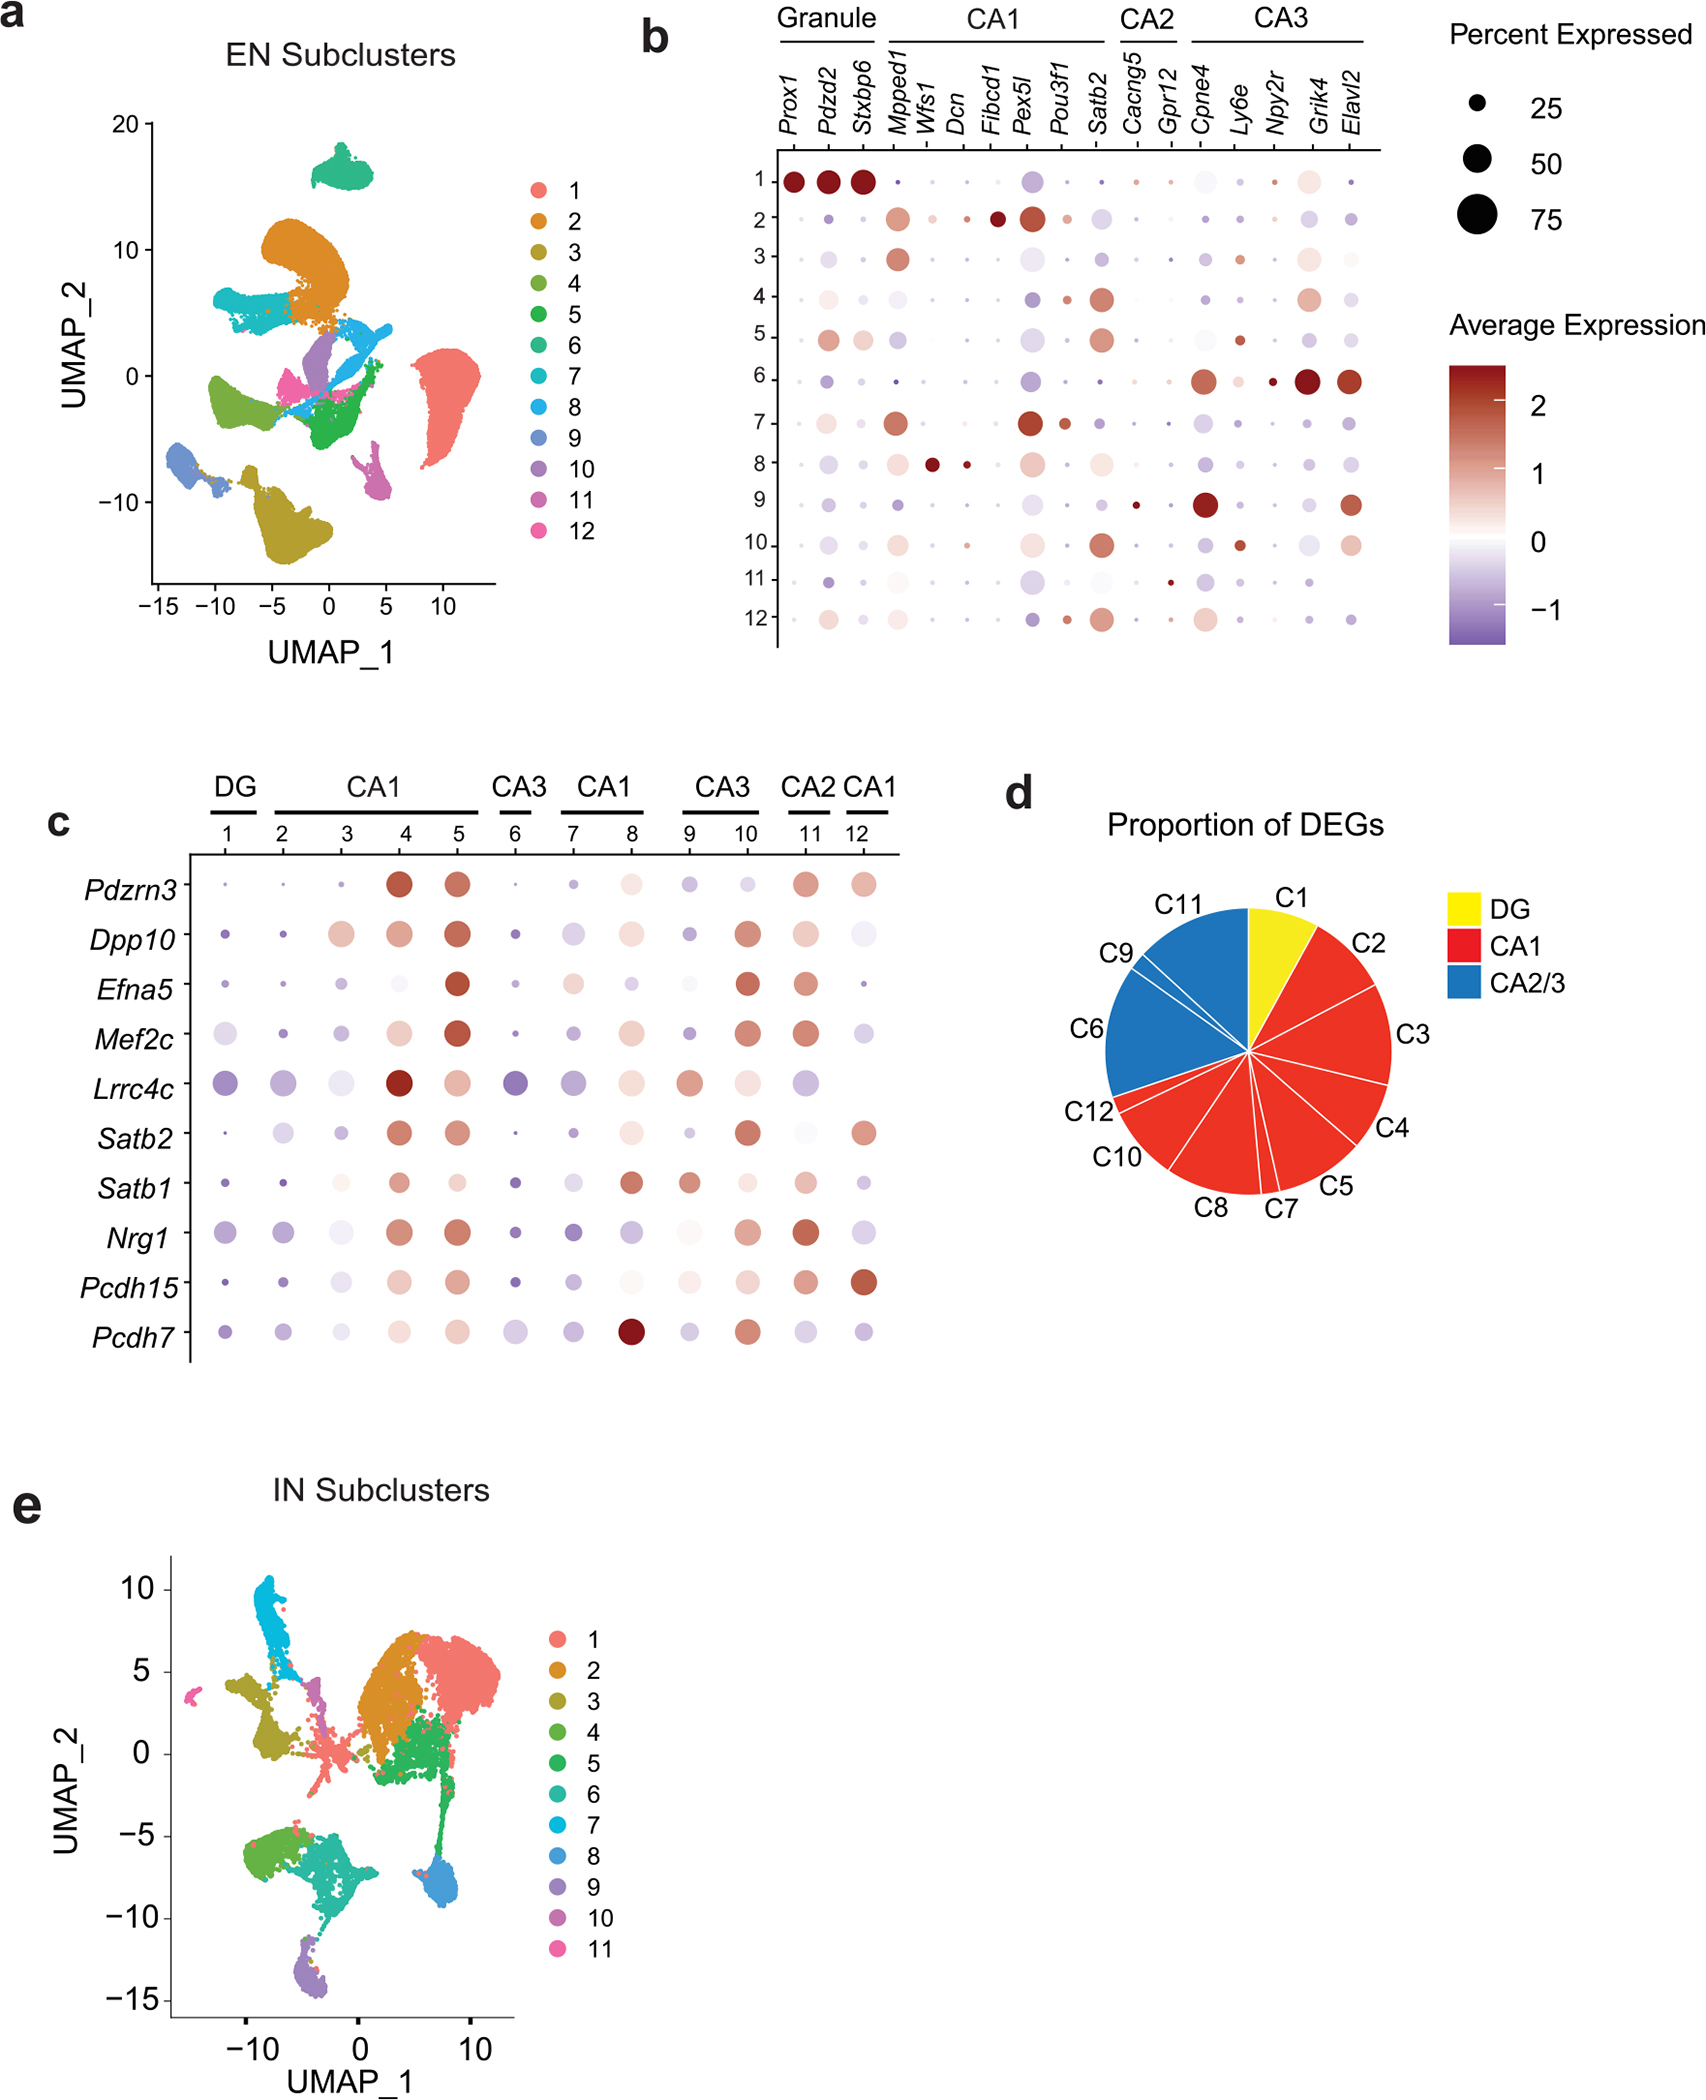
Extended Data Fig. 6 |. Cellular markers of excitatory and inhibitory neurons identified in snRNA-seq analyses of hippocampi of P301S mice with or without cGAS (Related to Fig. 5).

a. UMAP projection showing 12 distinct hippocampal excitatory neuron populations identified using unsupervised clustering of snRNA-seq data. b. Dot plot showing classification of excitatory neuron clusters by expression of granule, CA1, CA2, and CA3 markers. c. Dot plot of top shared DEGs from excitatory neuron clusters showing their enrichment in the different excitatory neuron clusters categorized according to granule, CA1, and CA2/3 markers. d. Pie chart summarizing the proportion of DEGs from clusters pertaining to dentate gyrus (DG), CA1, and CA2/3 clusters. e. UMAP projection showing 11 distinct hippocampal inhibitory neuron populations identified using unsupervised clustering of snRNA-seq data.
