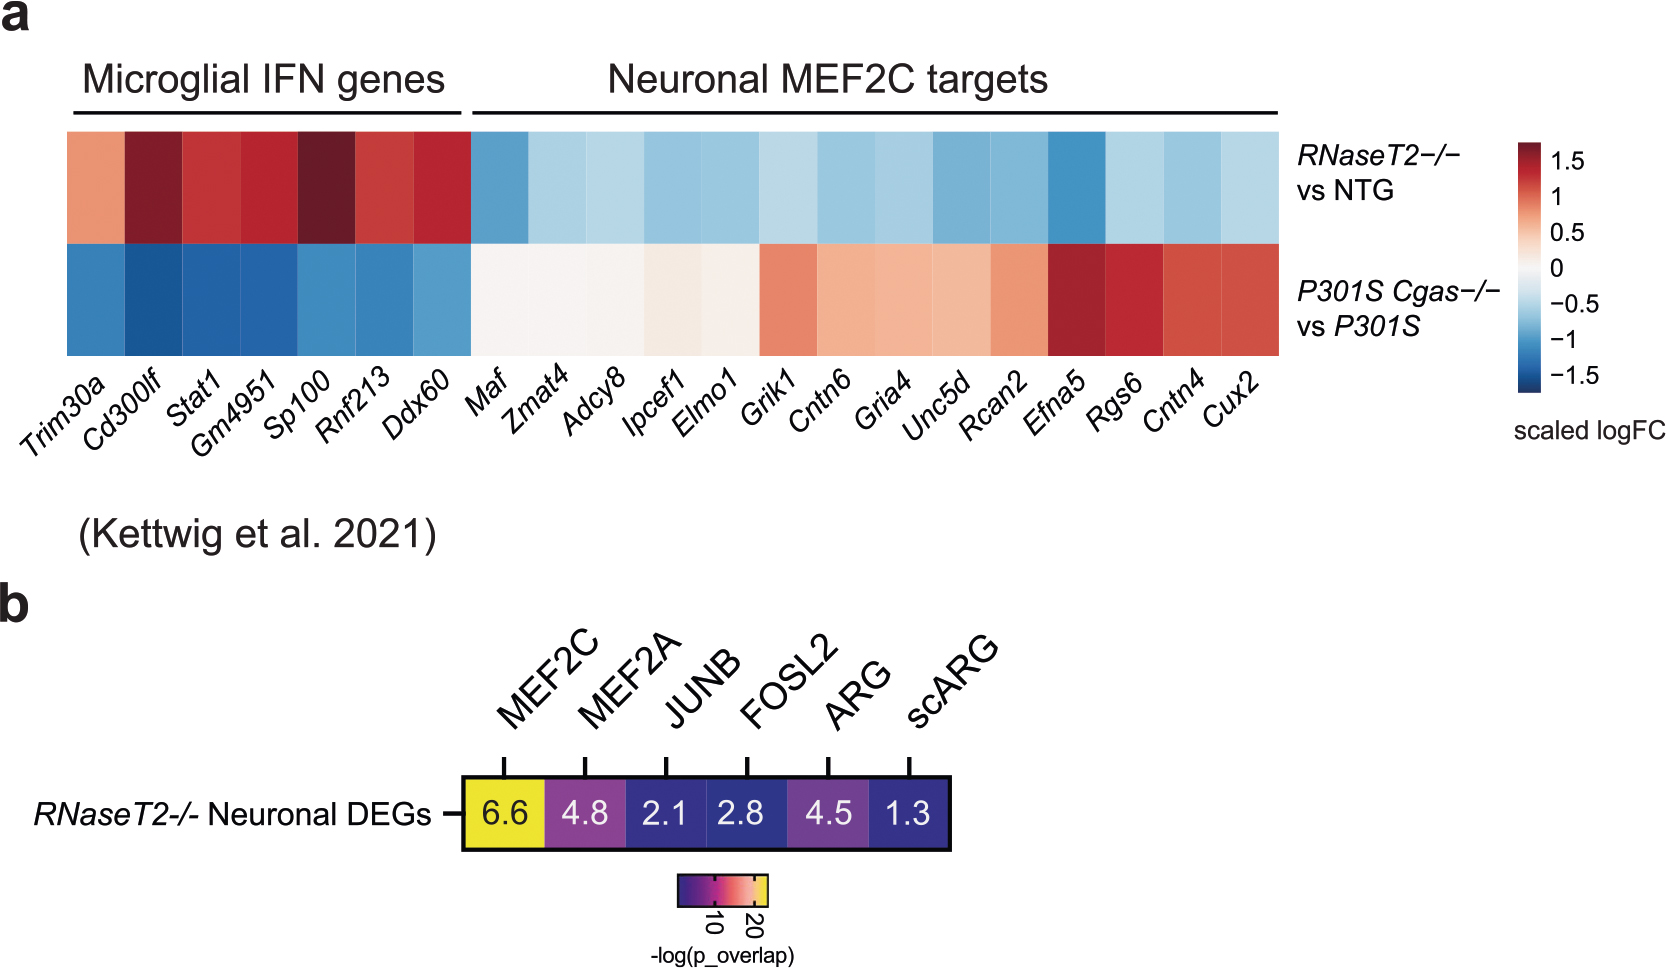
Extended Data Fig. 8 |. Downregulation of neuronal MEF2C transcriptional network in RNaseT2−/− interferonopathy (Related to Fig. 5).

a. Heatmap of scaled log fold-change of microglia interferon genes and neuronal MEF2C targets in RNaseT2−/− vs Ntg and P301S Cgas−/− vs P301S. b. Statistical enrichment analysis of overlap between RNaseT2−/− neuronal DEGs and MEF2C, MEF2A, JUNB, FOSL2, activity-regulated genes, and single-cell activity regulated genes (scARG). Numbers in the heatmap refers to odds ratios, color refers to −log(overlapping_p_val) via Fisher’s exact test.
