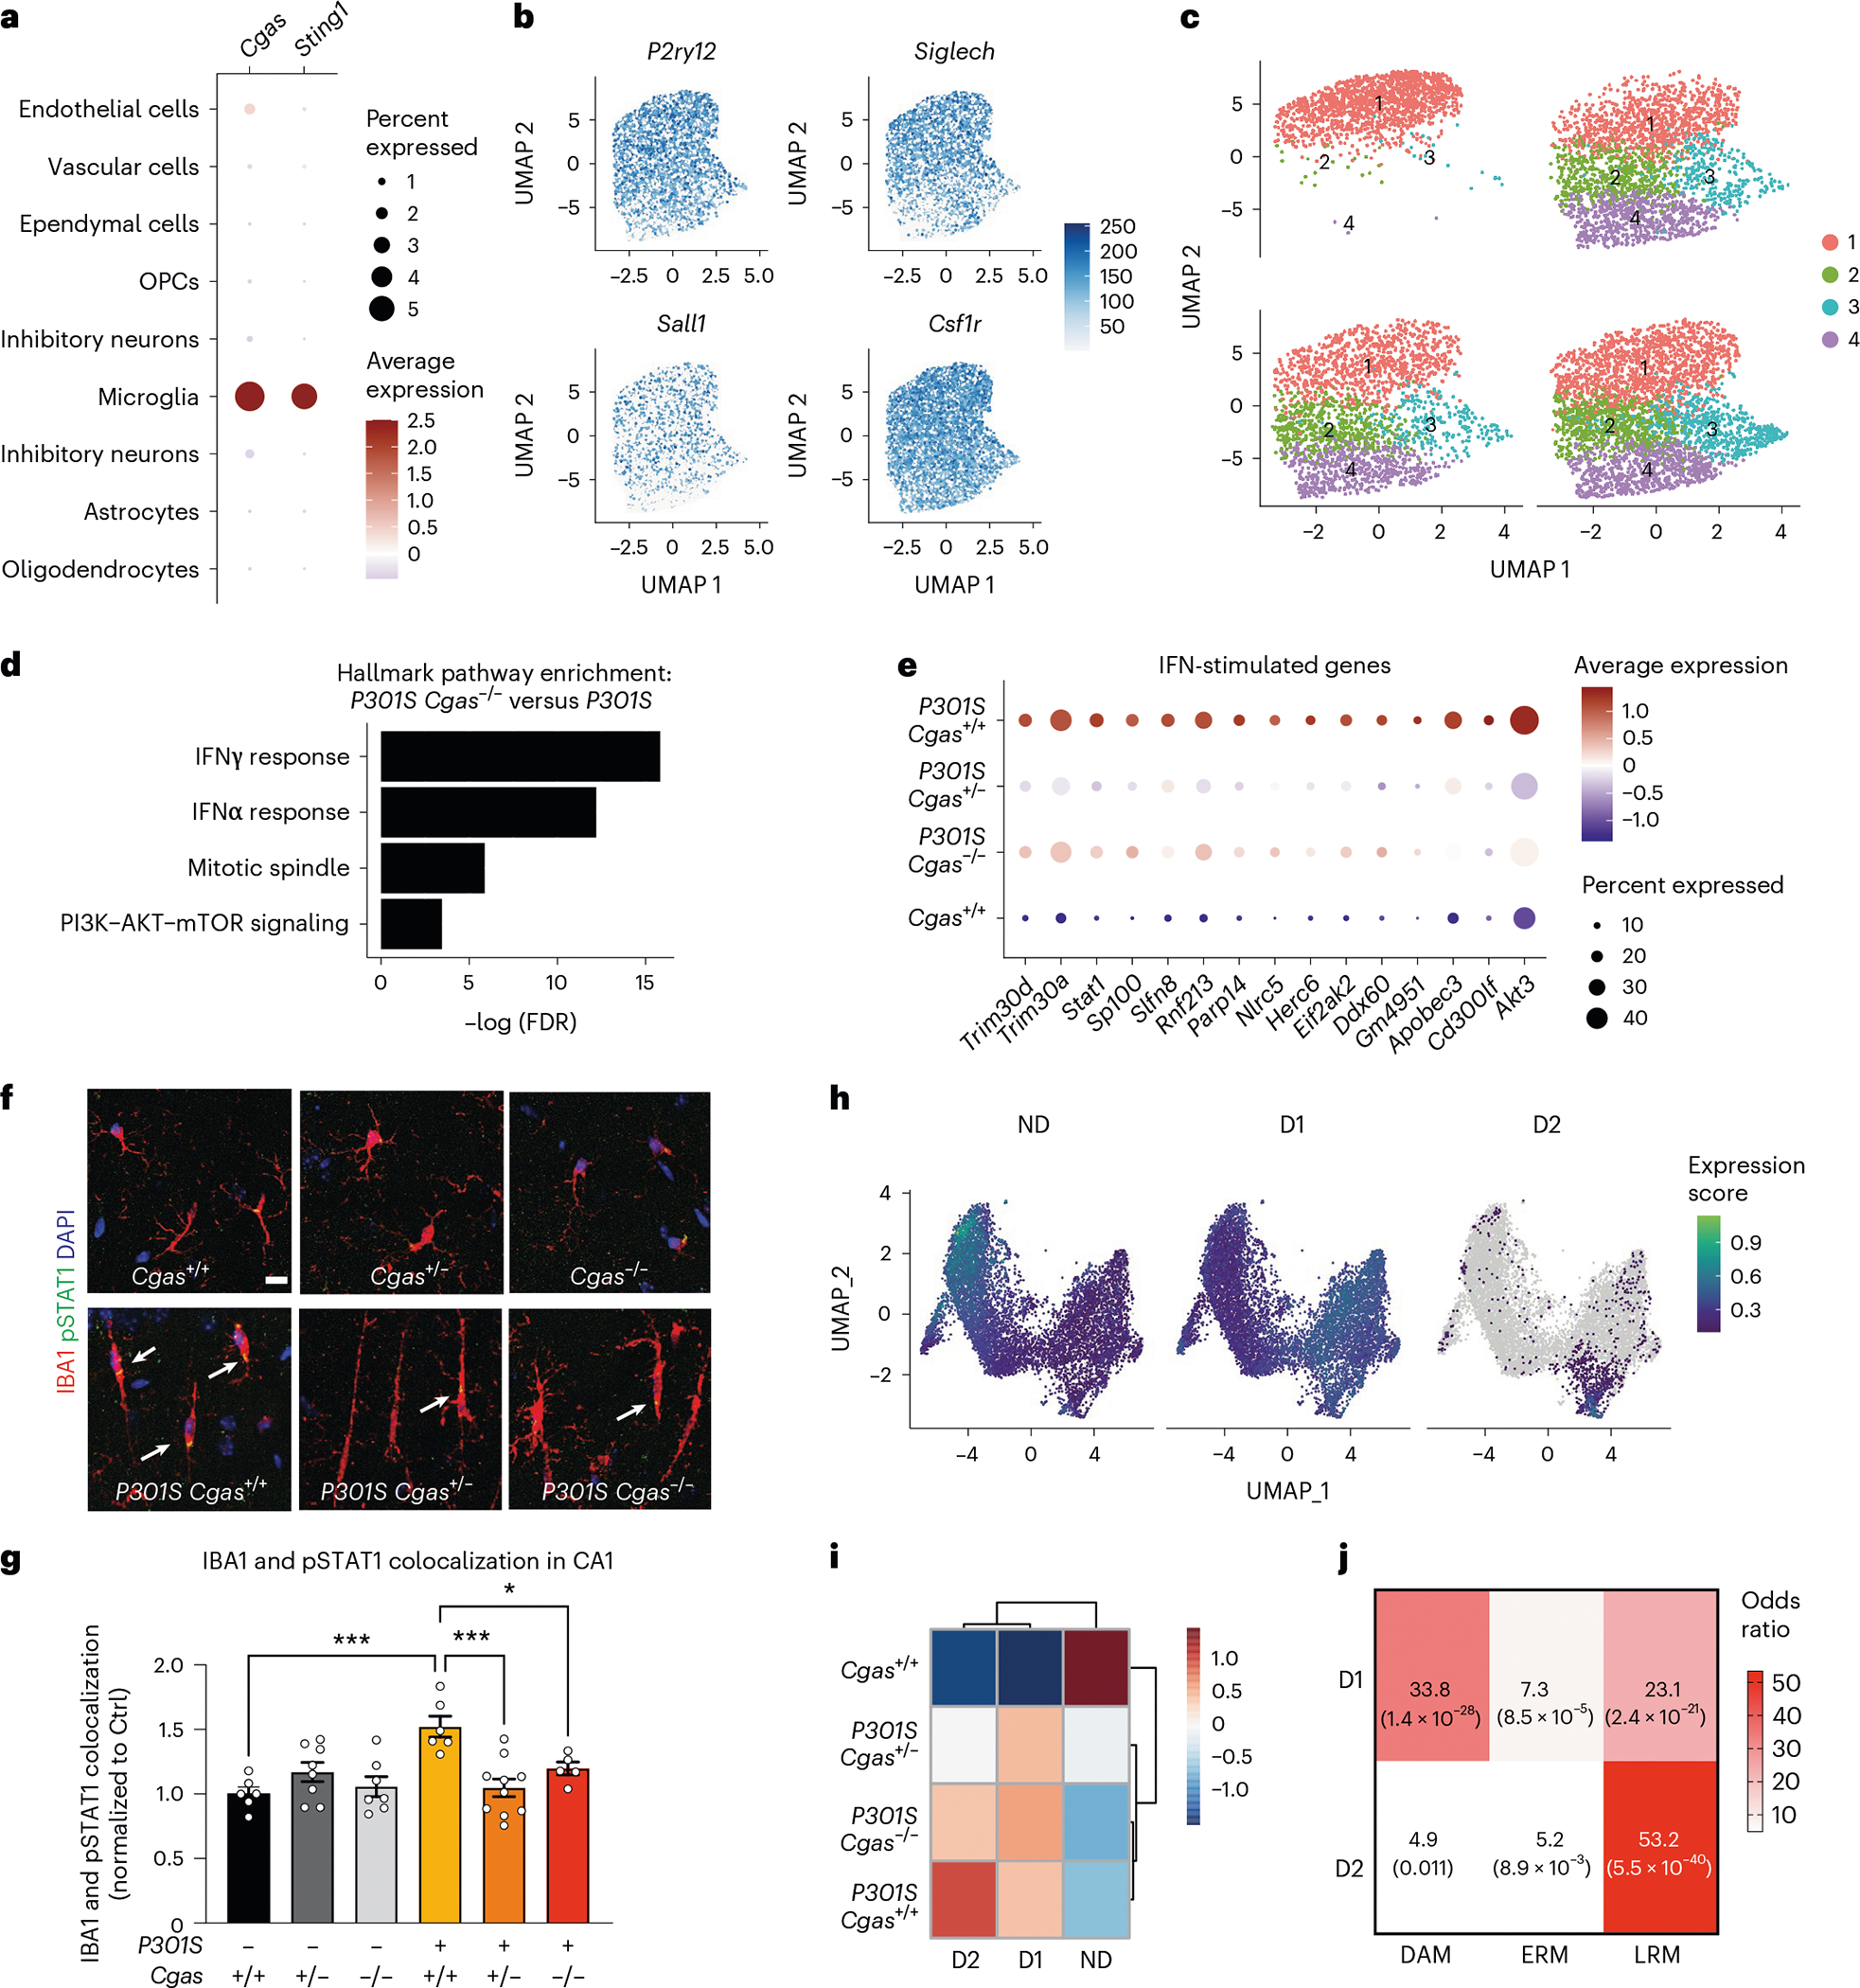
Fig. 3 |. cGAS promotes a tauopathy-associated microglial IFN signature distinct from DAMs.

a, Dot plot of normalized cell-type expression of Cgas and Sting1 (Tmem173) in snRNA-seq samples; OPCs, oligodendrocyte progenitor cells. b, Uniform manifold approximation and projection (UMAP) plots showing strong expression of marker genes P2ry12, Siglech, Sall1 and Csf1r in snRNA-seq microglial populations (n = 6 per genotype except for n = 5 for Cgas+/+). c, UMAP plots colored according to microglial subclusters and split by genotype. d, Gene set enrichment analysis showing that hallmark pathways associated with significantly downregulated genes (log2 FC < −0.1 and FDR < 0.05) in P301S Cgas−/− versus P301S are IFN pathways. e, Dot plot showing IFN-stimulated genes that are significantly lower in P301S Cgas+/− and P301S Cgas−/− microglia than in P301S Cgas+/+ microglia. f, Representative ×63 confocal images of immunostaining of pSTAT1 in the CA1 stratum radiatum of the mouse hippocampus; scale bar, 10 μm. g, Mean intensity of pSTAT1 measured in IBA1+ microglia in the CA1 striatum radiatum. Each circle represents the average intensity measurement of three images per animal. Data are reported as mean ± s.e.m.; n = 6 Cgas+/+, n = 8 Cgas+/−, n = 7 Cgas−/−, n = 6 P301S Cgas+/+, n = 9 P301S Cgas+/−, n = 5 P301S Cgas−/−. Cgas+/+ versus P301S Cgas+/+: ***P = 0.0002, P301S Cgas+/+ versus P301S Cgas+/−: ***P = 0.0002, P301S Cgas+/+ versus P301S Cgas−/−: *P = 0.0415. Data were analyzed by two-way ANOVA followed by a Tukey multiple comparison test. h, UMAP plots showing gene expression modules associated with microglial transformation; ND, non-disease. i, Heat map showing the association of gene modules with genotype. j, Analysis of D1 and D2 markers compared to DAM, early-response microglia (ERM) signatures and late-response microglia (LRM) signatures.
