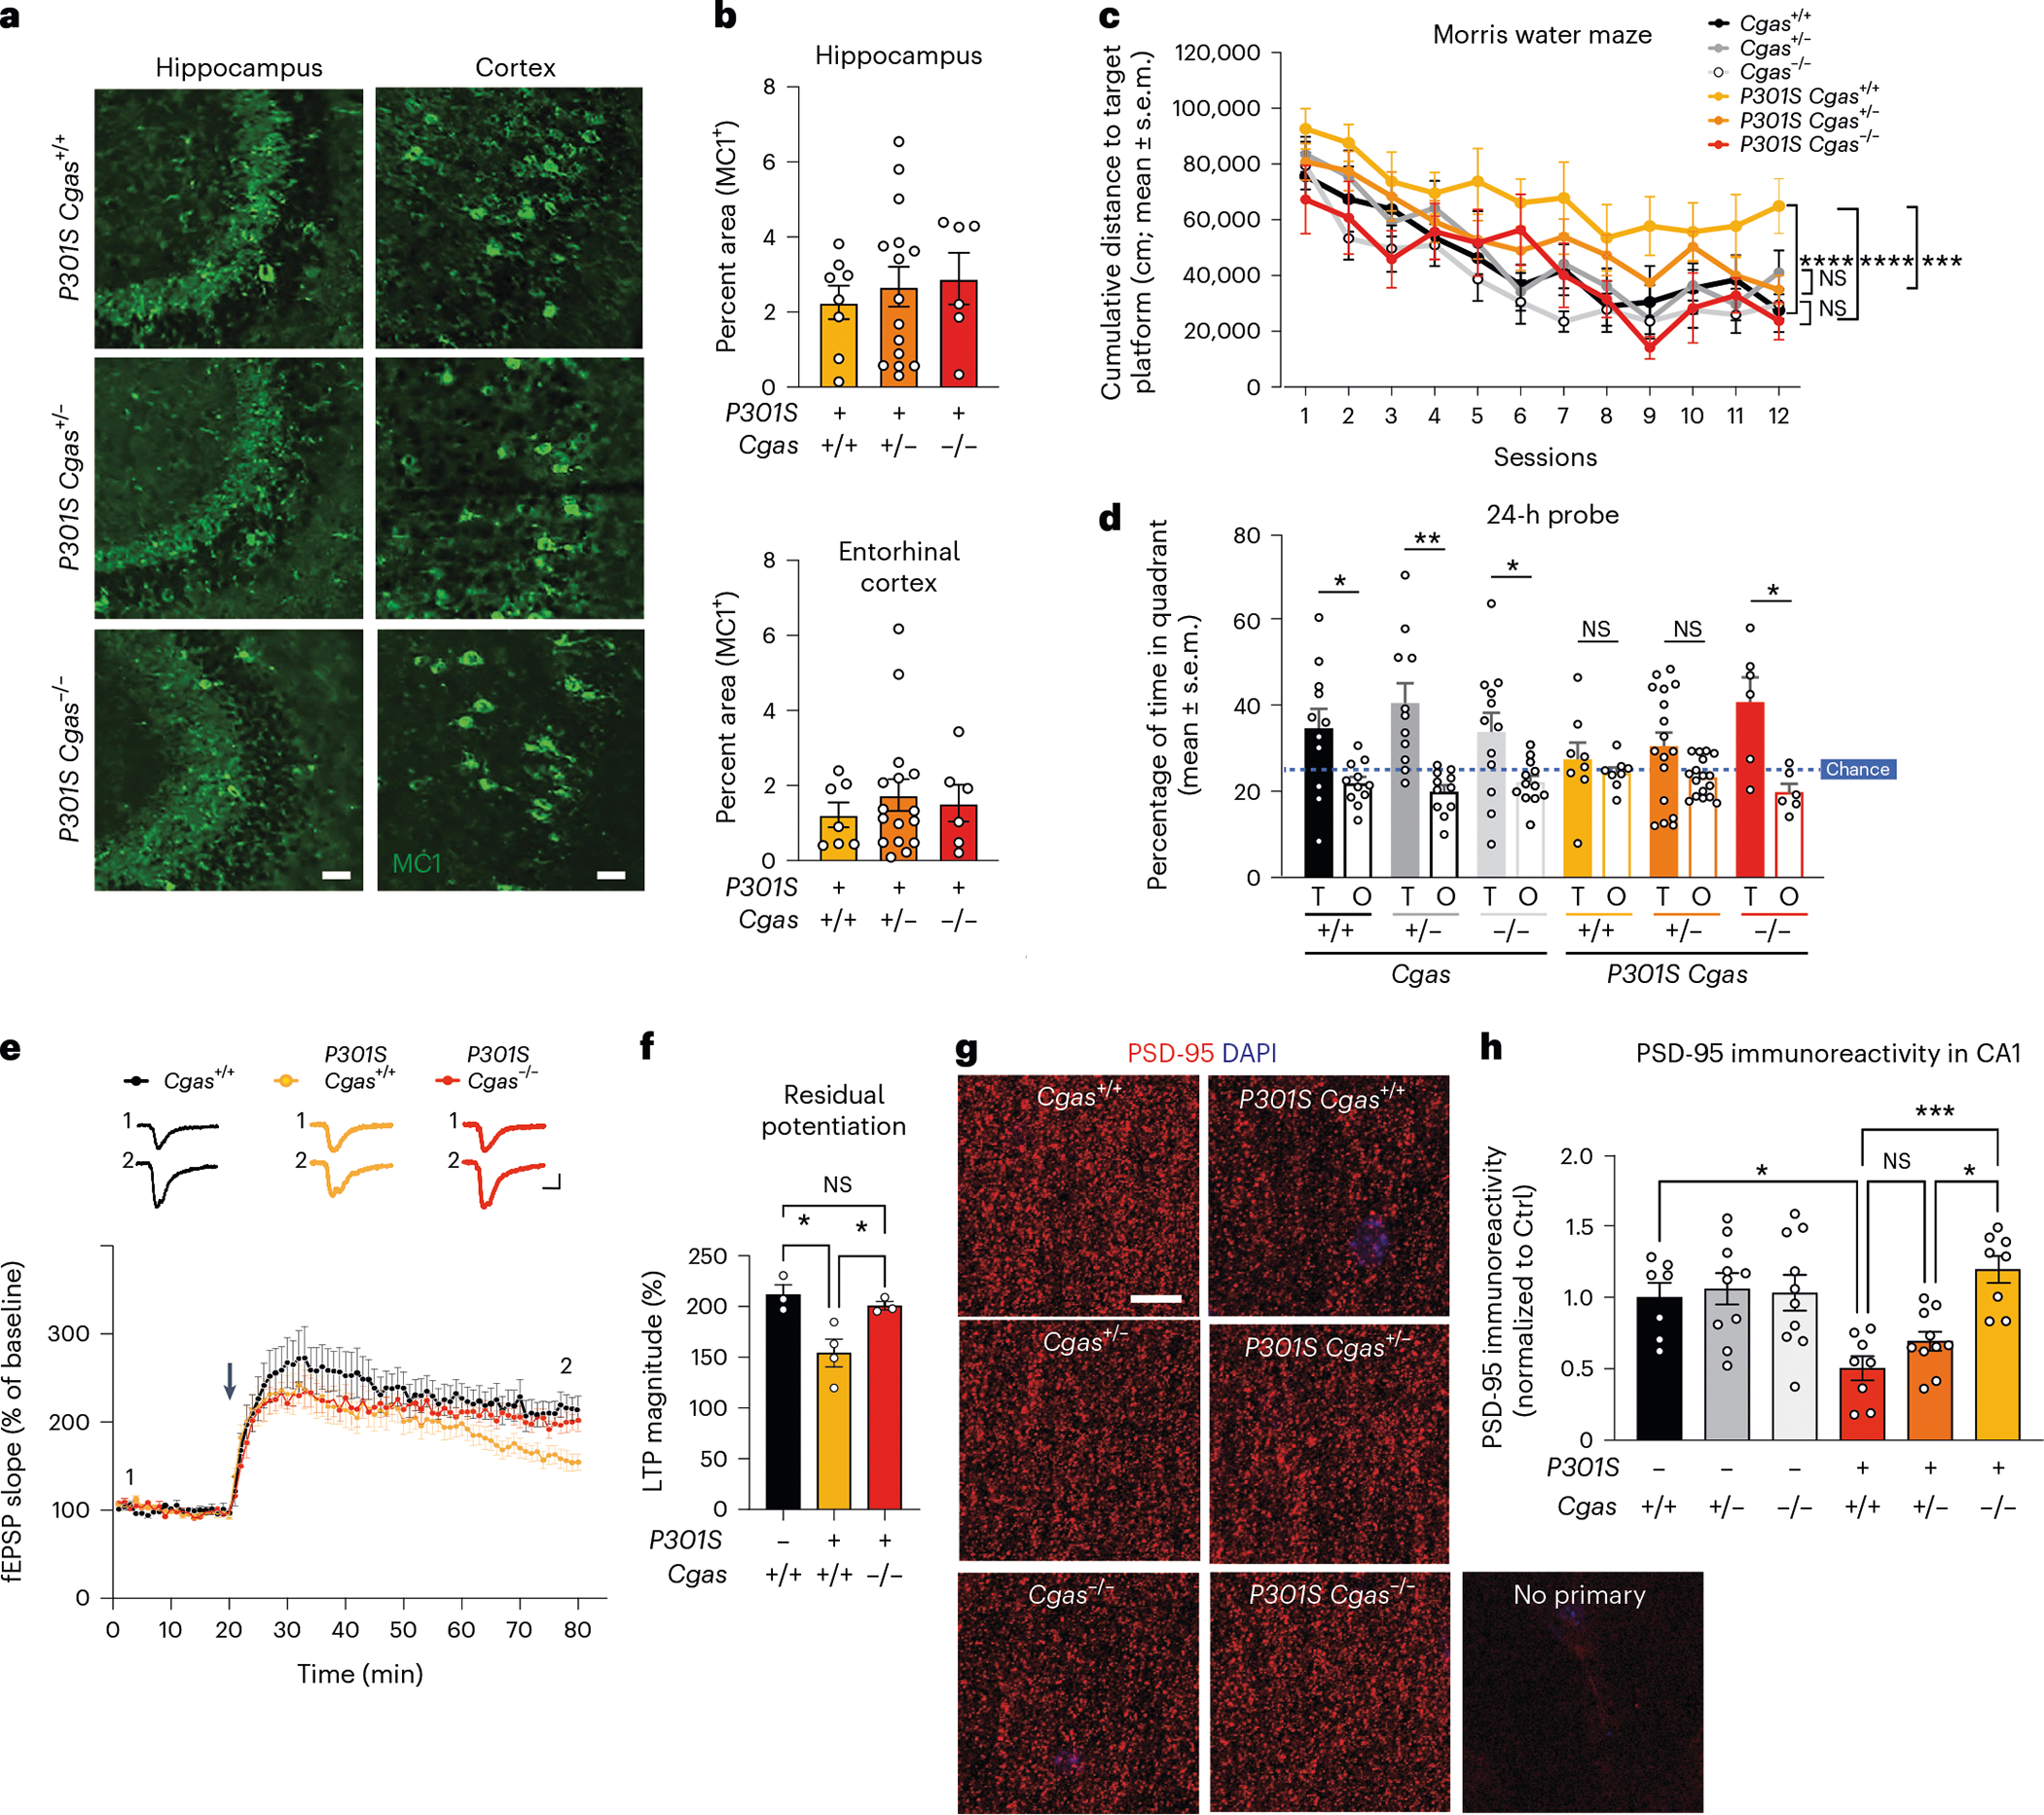
Fig. 4 |. Loss of cGAS rescues tauopathy-induced hippocampal synapse loss, synaptic plasticity and memory deficits without affecting tau load.

a, Representative immunofluorescence images of MC1 immunostaining in the hippocampi and entorhinal cortexes of 8- to 9-month-old mice; scale bar, 50 μm. b, Percentage of MC1+ area in the hippocampus or entorhinal cortex of P301S Cgas+/+, P301S Cgas+/− and P301S Cgas−/− mice. Data were analyzed by two-way ANOVA. c, Cumulative search distance to target platform during hidden trials (sessions 1–12) in a Morris water maze assessment of spatial learning and memory in 7- to 8-month-old P301S Cgas+/+, P301S Cgas+/− and P301S Cgas−/− mice and their non-transgenic littermates. Males and females were tested on separate days. Data represent both sexes combined; n = 12 Cgas+/+, n = 11 Cgas+/−, n = 11 Cgas−/−, n = 8 P301S Cgas+/+, n = 17 P301S Cgas+/−, n = 6 P301S Cgas−/−. Cgas+/+ versus P301S Cgas+/+: ****P < 0.0001; P301S Cgas+/+ versus P301S Cgas−/−: ****P < 0.0001; P301S Cgas+/+ versus P301S Cgas+/−: ***P = 0.0002. Data were analyzed by two-way ANOVA with a Tukey multiple comparisons test; NS, not significant. d, Percentage of time spent in the target (T) or the average time spent in the nontarget (others; O) quadrants during the 24-h probe in the W Morris water maze. assessment; n = 12 Cgas+/+, *P = 0.0293; n = 11 Cgas+/−, ** P = 0.0035; n = 11 Cgas−/−, *P = 0.0370; n = 8 P301S Cgas+/+; n = 17 P301S Cgas+/−; n = 6 P301S Cgas−/−, *P = 0.0209. Data were analyzed by one-tailed paired t-test. e, Field excitatory postsynaptic potentials (fEPSPs) were recorded in the dentate gyrus molecular layer, and a TBS protocol was applied (arrow) to the perforant pathway to induce LTP. Representative traces show fEPSPs before and after LTP induction (top); scale bars, 0.4 mV and 5 ms. The fEPSP slope measurements made up to 60 min after TBS were normalized to the mean baseline fEPSP slope before LTP induction (bottom, 8–11 slices from three to four mice: n = 3 Cgas+/+, n = 4 P301S Cgas+/+, n = 3 P301S Cgas−/−). f, The LTP magnitude was calculated from the normalized mean fEPSP slope 55–60 min after TBS was applied. Data are reported as mean ± s.e.m. (8–11 slices from three to four mice per group; n = 3 Cgas+/+, n = 4 P301S Cgas+/+, n = 3 P301S Cgas−/−. Cgas+/+ versus P301S Cgas+/+: *P = 0.0191; P301S Cgas+/+ versus P301S Cgas−/−: *P = 0.0477. Data were analyzed by one-way ANOVA followed by a Tukey multiple comparisons test. g, Representative confocal images of the hippocampal CA1 striatum radiatum labeled with PSD-95 antibody; scale bar, 10 μm. h, Mean intensity of PSD-95 puncta measured in the CA1 striatum radiatum. Each circle represents the average intensity measurement of three to five images per animal. Data are presented as normalized to control. Error bars represent mean ± s.e.m. (n = 7 Cgas+/+, n = 10 Cgas+/−, n = 10 Cgas−/−, n = 8 P301S Cgas+/+, n = 10 P301S Cgas+/−, n = 8 P301S Cgas−/−; Cgas+/+ versus P301S Cgas+/+: *P = 0.0275; P301S Cgas+/− versus P301S Cgas−/−: *P = 0.0111; P301S Cgas+/+ versus P301S Cgas−/−: ***P = 0.0004). Data were analyzed by two-way ANOVA followed by a Tukey multiple comparisons test.
