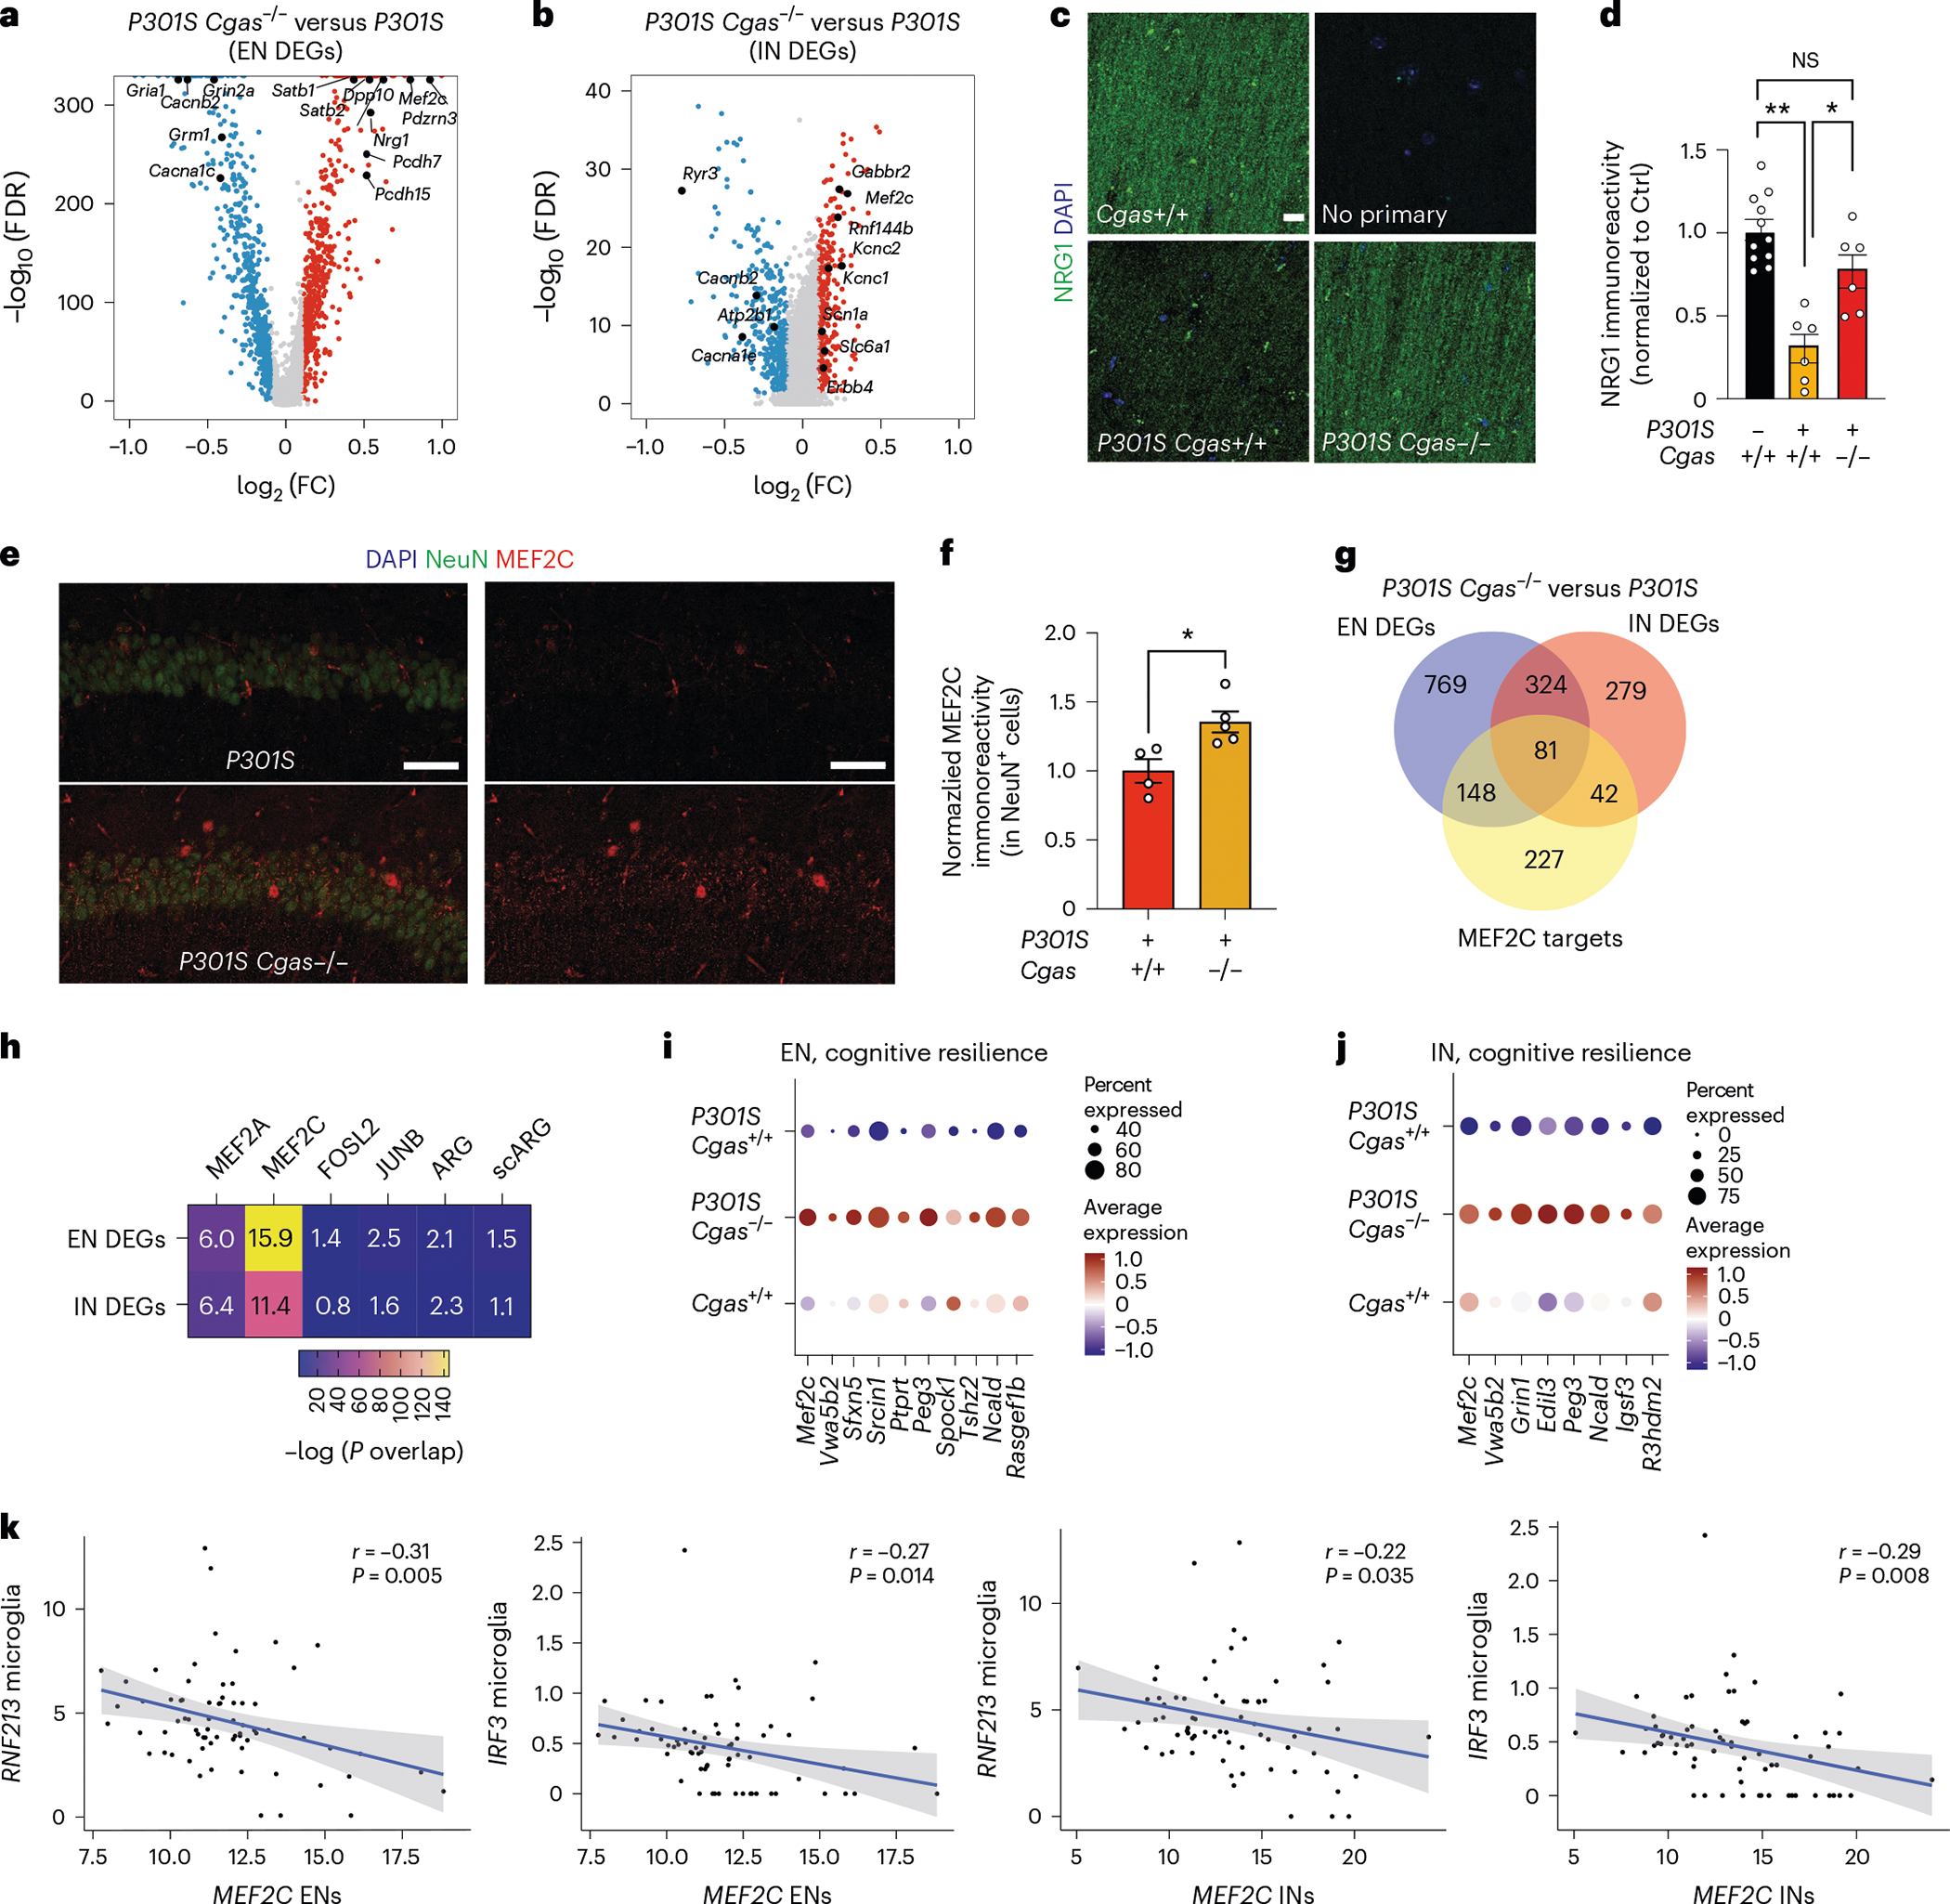
Fig. 5 |. The MEF2C transcription network is enhanced by Cgas deletion and inversely correlates with the microglial IFN response in mice and humans.

a, Volcano plot showing representative DEGs that are upregulated in P301S Cgas−/− compared to in P301S Cgas+/+ ENs; log2 FC of >0.1 or <−0.1, FDR < 0.05. b, Volcano plot showing representative DEGs that are upregulated in P301S Cgas−/− compared to in P301S Cgas+/+ INs; log2 FC of >0.1 or <−0.1, FDR < 0.05. c, Representative confocal images of immunostaining of NRG1 in the CA1 stratum radiatum of the mouse hippocampus; scale bar, 10 μm. d, Mean intensity of NRG1 measured in the CA1 striatum radiatum. Each circle represents the average intensity measurement of three images per animal. Data are reported as mean ± s.e.m.; n = 11 Cgas+/+, n = 6 P301S Cgas+/+, n = 8 P301S Cgas+/−, n = 6 P301S Cgas−/−. Cgas+/+ versus P301S Cgas+/+: **P = 0.0016, P301S Cgas+/+ versus P301S Cgas−/−: *P = 0.0203. Data were analyzed by two-way ANOVA followed by a Tukey multiple comparisons test. e, Representative ×40 confocal images of immunostaining of MEF2C and NeuN in the CA1 pyramidal layer of the mouse hippocampus; scale bar, 50 μm. f, Mean intensity of MEF2C in MEF2C+NeuN+ neurons in the CA1 pyramidal layer. Each circle represents the average intensity measurement of three images per animal. Data are presented as normalized to control. Data are reported as mean ± s.e.m.; n = 4 P301S Cgas+/+, n = 5 P301S Cgas−/−; *P = 0.0178. Data were analyzed by two-tailed unpaired t-test g, Venn diagram of the overlaps among EN DEGs, IN DEGs and MEF2C target genes. h, Heatmap showing the overlap between EN/IN DEGs and lists of TF target genes (MEF2A, MEF2C, FOSL2 and JUNB) and activity-induced DEGs (ARG and scARG). Numbers in each box represent the overlapping odds ratio. Overlapping P values were calculated with a Fisher’s exact test. i, Dot plot showing the expression of DEGs significantly upregulated by Cgas deletion (FDR < 0.05, log2 FC ≥ 0.1) that are positively correlated with human cognitive resilience in EN clusters. j, Dot plot showing the expression of significantly upregulated DEGs by Cgas deletion (FDR < 0.05, log2 FC ≥ 0.1) that are positively correlated with human cognitive resilience in IN clusters. k, Simple linear regression analysis with standard error showing negative correlations between the expression of MEF2C in ENs and RNF213 (r = −0.31, P = 0.005) and IRF3 (r = −0.27, P = 0.014) in microglia and MEF2C in INs and RNF213 (r = −0.22, P = 0.035) and IRF3 (r = −0.29, P = 0.008) in microglia in 70 individuals with AD.
