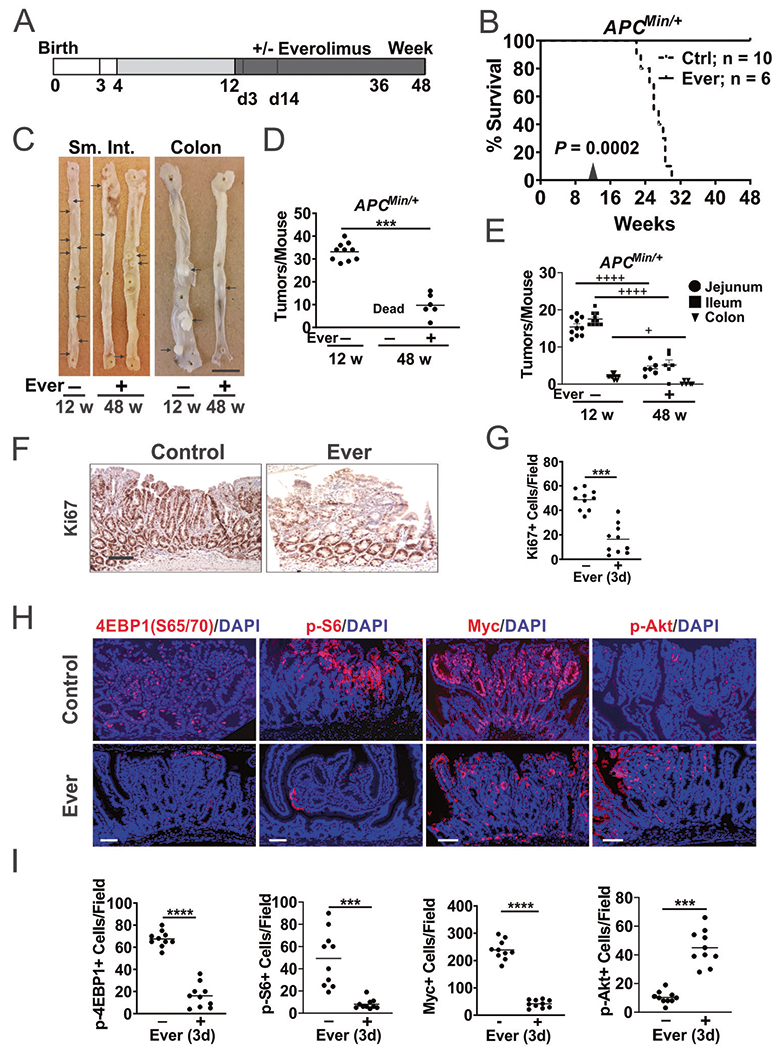
Fig. 1. Everolimus regresses established intestinal polyps in APCMin/+ mice.

APCMin/+ mice were fed control (Ctrl) diet from 4–12 weeks to established polyps followed by Ctrl diet with or without Everolimus (Ever) till week 48. A Schematic of polyp establishment, treatment, and harvest. The small intestine (SI), colon and polyps were analyzed on week 12 (12 w), day 3 or 14 of the treatment (3d, 14d later), and week 48 (48 w, 36 w treatment). B Kaplan–Meier curve of APCMin/+ mice at 48 w. Log-Rank test. C Representative images of whole mount small intestine and colon from mice. Bar = 1 cm. Polyps are indicated with arrows. D Quantitation of total macroscopic adenomas from (C). E Quantitation of macroscopic adenomas in different regions from (C). n = 10 or 6 mice/group. F Representative Ki67 IHC staining at 3d. Bar = 100 μm. G Quantitation of positive cells per 400× field from (F). H Representative IF staining of the indicated proteins in polyps at d3. Bars = 100 μm. I Quantitation of positive cells per 400× field from (H). Nuclear Myc was scored. D, E n = 6–10 mice/group. G, I, n = 3 mice/group, and 3–4 randomly chosen polyps/mouse. ***P < 0.001, ****P < 0.0001 (Student’s T-Test, two-tailed). +P < 0.05, ++++P < 0.0001 (One-way ANOVA and Tukey Post-Hoc test).
