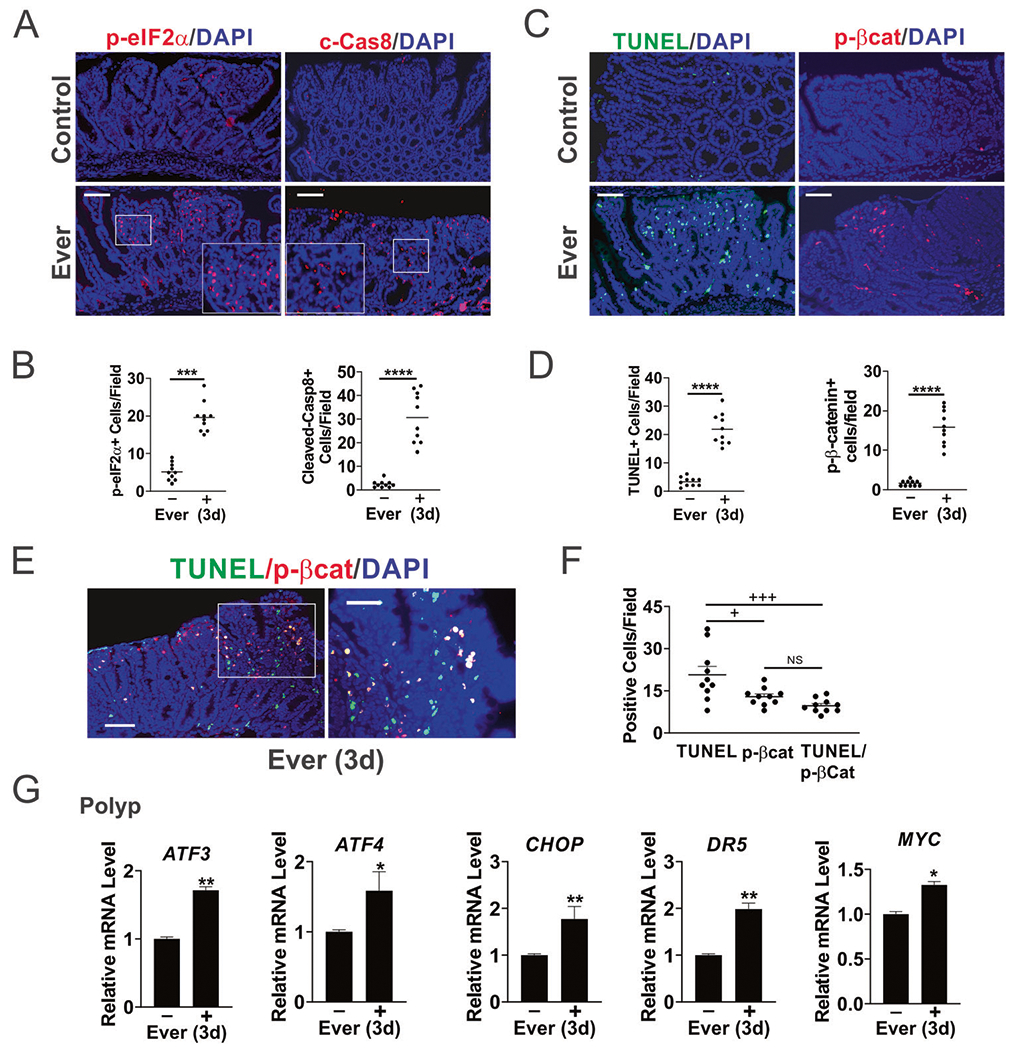
Fig. 2. Everolimus selectively induces apoptosis and ER stress in the polyps.

APCMin/+ mice with established polyps were treated with Everolimus for 3 days [3d]. Small intestinal polyps were analyzed. A Representative phospho-eIF2α (S51, p-eIF2α) and Cleaved-caspase-8 (c-Cas8) IF staining in the polyps. Higher magnification images are shown in insets. Bar = 100 μm. B Quantitation of p-eIF2α+ and c-Cas8+ per 400× field from A. Bar = 100 μm. C Representative TUNEL and phospho-β-catenin (S552) (p-βcat) IF staining. Bar = 100 μm. D Quantitation of TUNEL+ and p-βcat+ cells per 400× field from (C). E Representative TuNEL/p-βcat double IF staining. Bar = 100 μm. F Quantitation of cells per 400× field from (E). G qRT-PCR analysis of the indicated genes. cDNA was made from pooled polyps, 3–5 polyps/mouse, and 3 mice/group. B, D, F, G, n = 3 mice/group. *P < 0.05, **P < 0.01, ***P < 0.001, ****P < 0.001 (Student’s T-test, two-tailed). +P < 0.05, +++P < 0.0001 (one-way ANOVA and Tukey Post-Hoc test).
