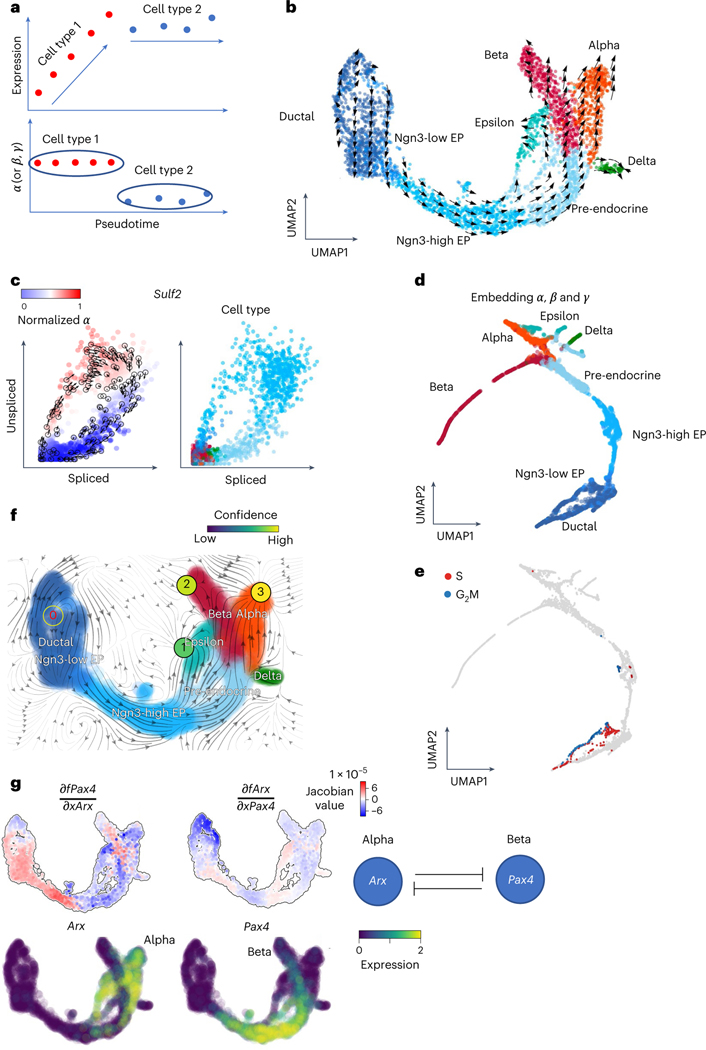
Fig. 4 |. Deciphering cell identity with cell-specific reaction rates and analyzing gene regulation through vector fields.
a, Schematic illustration shows that the , or rates of the genes may be a good indicator of the cell types rather than the expressions of the genes. b, The velocities derived from cellDancer for the pancreatic endocrinogenesis cells are visualized on the pre-defined UMAP embedding. c, Phase portraits of the gene Sulf2. The rates of the Sulf2 gene for each cell calculated by cellDancer clearly illustrate the gene’s induction and regression phases (left). Sulf2 is in induction in the Ngn3-high embryonic progenitor (EP) cell type and in regression in the pre-endocrine cell type, whereas it is barely transcribed in other cell types (right). d,e, UMAP embedding using the cell-specific , and rates calculated by cellDancer indicates that our computed kinetics rates might be useful in assigning cell subpopulations (d) and cell identity (e). f, The velocity vector fields were learned by dynamo. The red digit 0 reflects the identified emitting fixed point. The black digits 1, 2 and 3 reflect the absorbing fixed points. g, Jacobian analysis and the gene expression of Arx and Pax4 on the UMAP space. It shows that Pax4 is downregulated by Arx in alpha-cells. Arx is downregulated by Pax4 in beta-cells.

