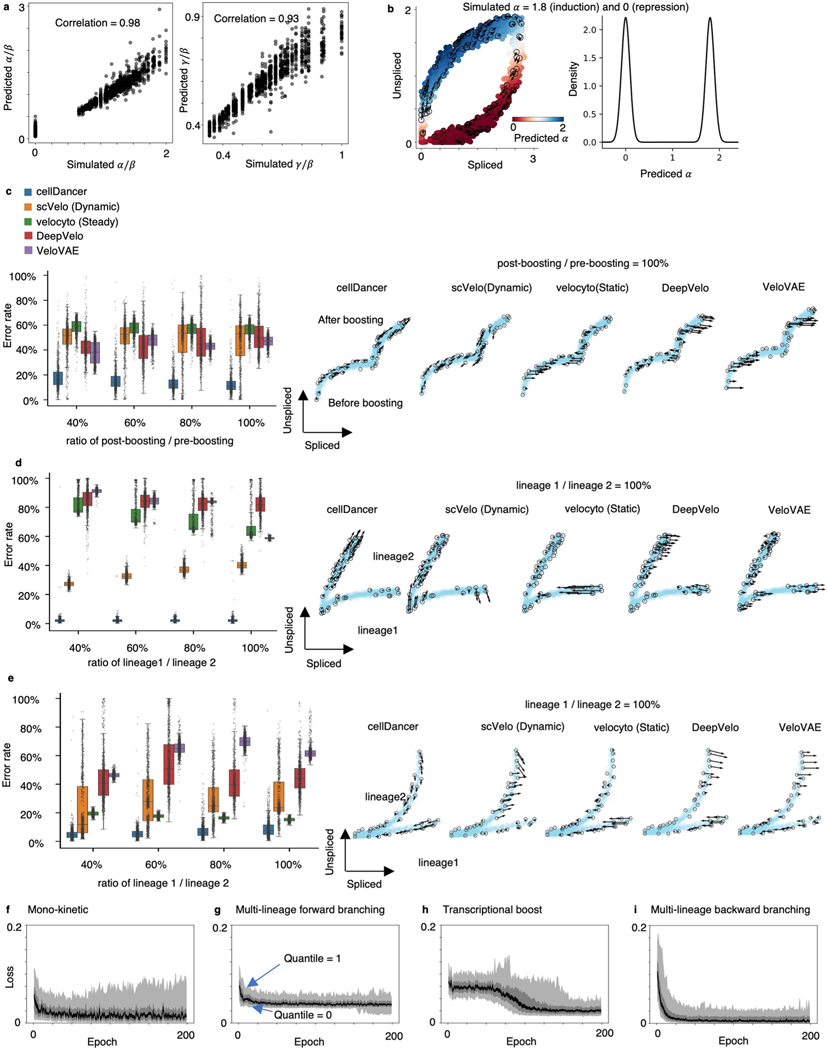
Extended Data Fig. 1 |. Resolving RNA velocity of simulated multiple rate kinetics genes.
(a) High correlation between the simulated (background truth) and the predicted (left) and (right). The Pearson correlation coefficients (R2) between the prediction and the simulation are computed. (b) RNA velocity predicted by cellDancer is projected onto the phase portraits of a simulated gene with equals 1.8 (induction) and 0 (repression) (left) and the density plot of the predicted (right). (c-e) We measured the accuracy by computing the error rate as the percentage of cells whose predicted RNA velocity is poorly correlated with the ground truth velocity (cosine similarity < 0.7). The box plots of the error rates show that cellDancer outperforms scVelo, velocyto, DeepVelo, and VeloVAE in the estimation of RNA velocities for the simulated transcriptional boost (c), multi-lineage forward branching (d), and multi-lineage backward branching (e) genes. Middle line in box plot, median; box boundary, interquartile range; whiskers, 10–90 percentile; minimum and maximum, not indicated in the box plot; gray dots, individual datapoints. The error rate is defined as the percentage of falsely predicted directions. Different sampling ratios were investigated at 40%, 60%, 80%, and 100% (n = 1,000 genes), representing the ratio of the number of post-boosting cells to the number of pre-boosting cells in (c) and the ratio of the number of cells in lineage 1 to the number of cells in lineage 2 (d-e). Example phase portraits for sampling ratio (1:1) are provided in each case. (f-i) The loss scores are plotted against epochs of training on the simulated mono-kinetic (top left), multi-lineage forward branching (top right), transcriptional boost (bottom left), and multi-lineage backward branching (bottom right) genes at quantiles 0, 0.1, 0.4, 0.6, 0.9, and 1. In all cases, the loss scores converge in about 25 epochs, except for the transcriptional boost genes, for which the convergence emerges in about 100 epochs.

