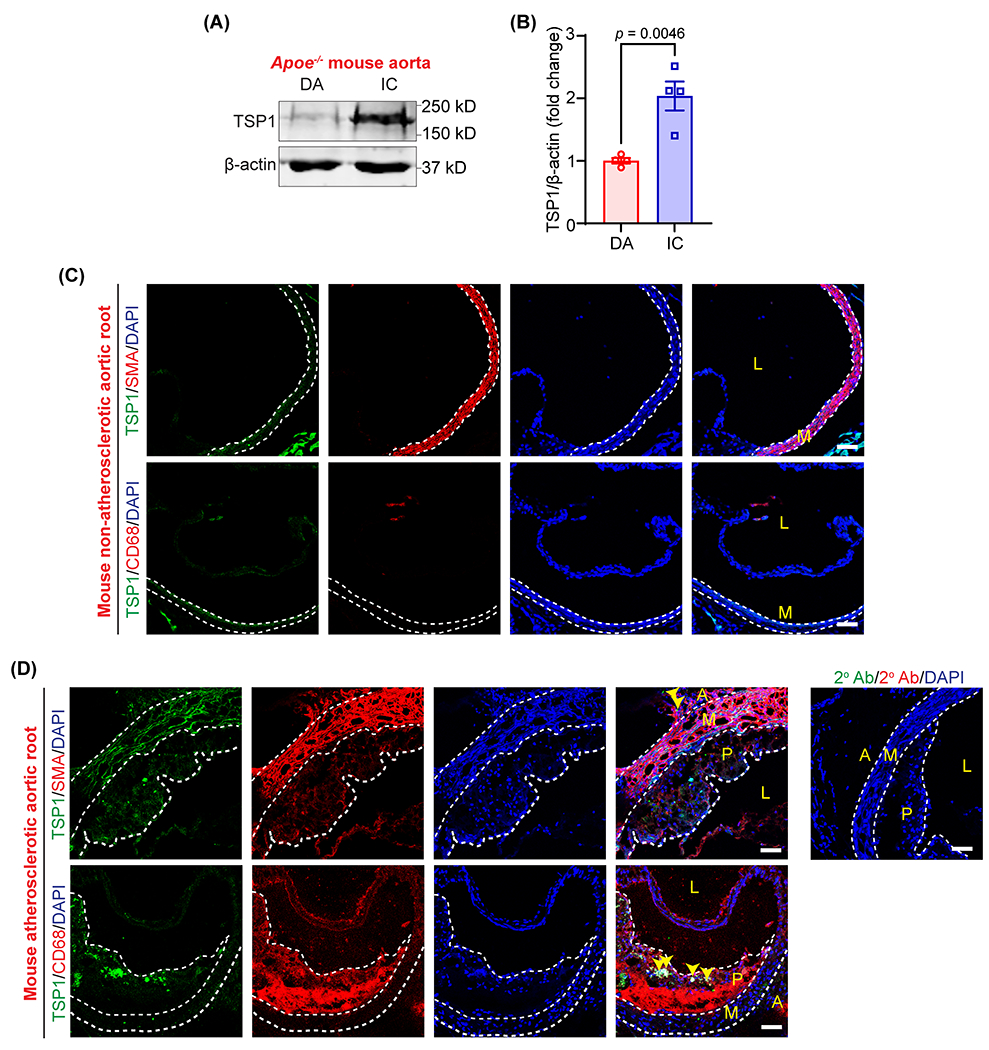
Fig. 1. TSP1 protein levels are upregulated in murine atherosclerotic arteries.

(A) Representative western blot images of TSP1 and β-actin expression in plaque-free DA segments and atherosclerotic IC of male Apoe−/− mice fed with a Western diet for 12 weeks. (B) Bar graph shows mean TSP1 protein levels (n = 4). (C & D) Wild-type and Apoe−/− mice (12 weeks Western diet) aortic sinus cross-sections were immunostained to investigate TSP1 (green), SMA (red), CD68 (macrophage marker, red), expression. Yellow arrowheads indicate TSP1 expression in adventitia and intraplaque areas (n = 3). Scale bar 50 μm. Statistical analyses were performed using a two-tailed unpaired student t-test (B). Data represent mean ± SEM. DA, descending aorta; IC, inner curvature; L, lumen; P, plaque; M, media and A, adventitia.
