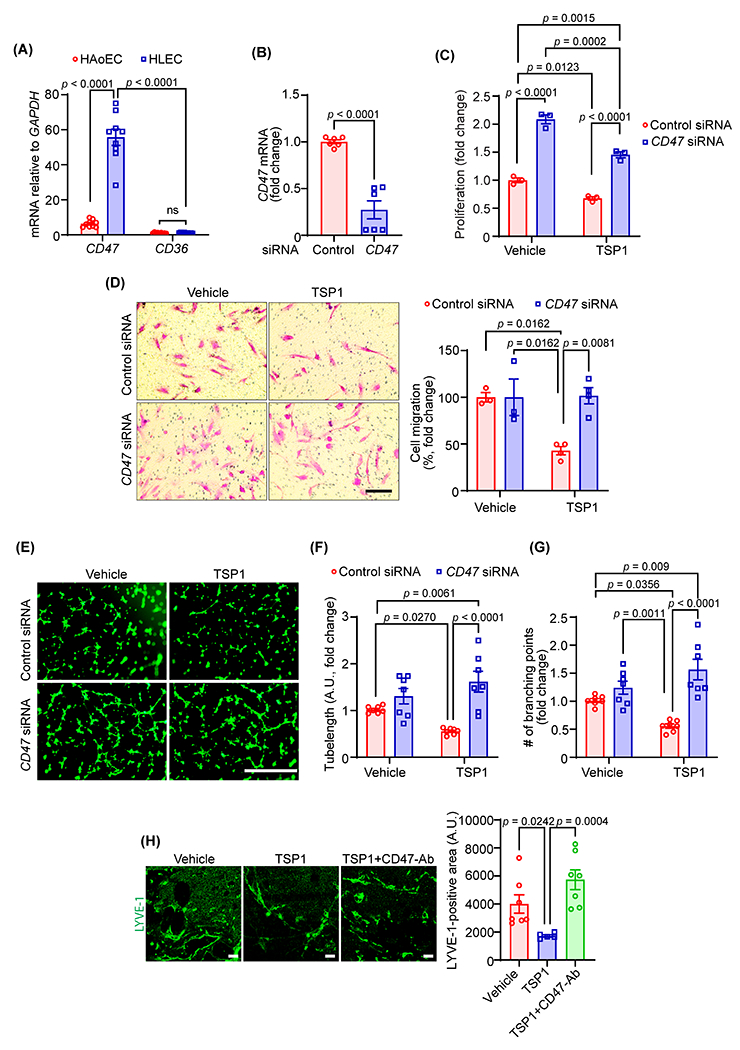
Fig. 3. CD47 mediates TSP1-induced inhibition of lymphangiogenesis.

(A) Quantitative real-time PCR was performed to determine the relative mRNA levels of CD47 and CD36 in human LEC (HLEC) and human aortic endothelial cells (HAoEC). Bar graph represents mRNA levels in comparison to CD36 (n = 9). (B) Control and CD47 siRNA-treated LEC (48 h) were utilized to quantify CD47 transcript expression using qRT-PCR (n = 6). (C) WST-1 assay was conducted to investigate the effects of CD47-silencing on LEC proliferation in response to TSP1 treatment as described in Fig. 2A. Data are representative of three independent experiments performed at least in quadruplicate. (D) Control and CD47-silenced LEC were used to evaluate cell migration. Scale bar 200 μm. Bar graph represents the percentage of migrated cells (n = 3-4). (E-G) Control and CD47-silenced cells were pretreated as in Fig. 2D and seeded in wells of a Matrigel-coated plate in basal medium containing VEGF-C ± TSP1 and tube formation determined. Representative images of tube formation are shown (E). Scale bar 1000 μm. Tube length (F) and number of branching points (G) quantified (n = 7). (H) Wild-type male mice were injected s.c. with Matrigel solutions premixed with either VEGF-C, VEGF-C+TSP1+IgG or VEGF-C+TSP1+CD47-blocking antibody. Plugs were isolated after 10 days, sectioned and immunostained for LYVE-1. Representative images of LYVE-1 staining of the cross-sections of the Matrigel plugs and quantification of LYVE-1-positive area are shown (n = 5-7). Scale bar 20 μm. Statistical analyses were performed using two-way ANOVA (A, C, D, F and G) with Bonferroni’s (A), Tukey’s (C, F and G) and Sidak’s (D) multiple comparisons test, two-tailed unpaired student t-test (B) and Kruskal-Wallis test for multiple comparisons (H). Data represent mean ± SEM.
