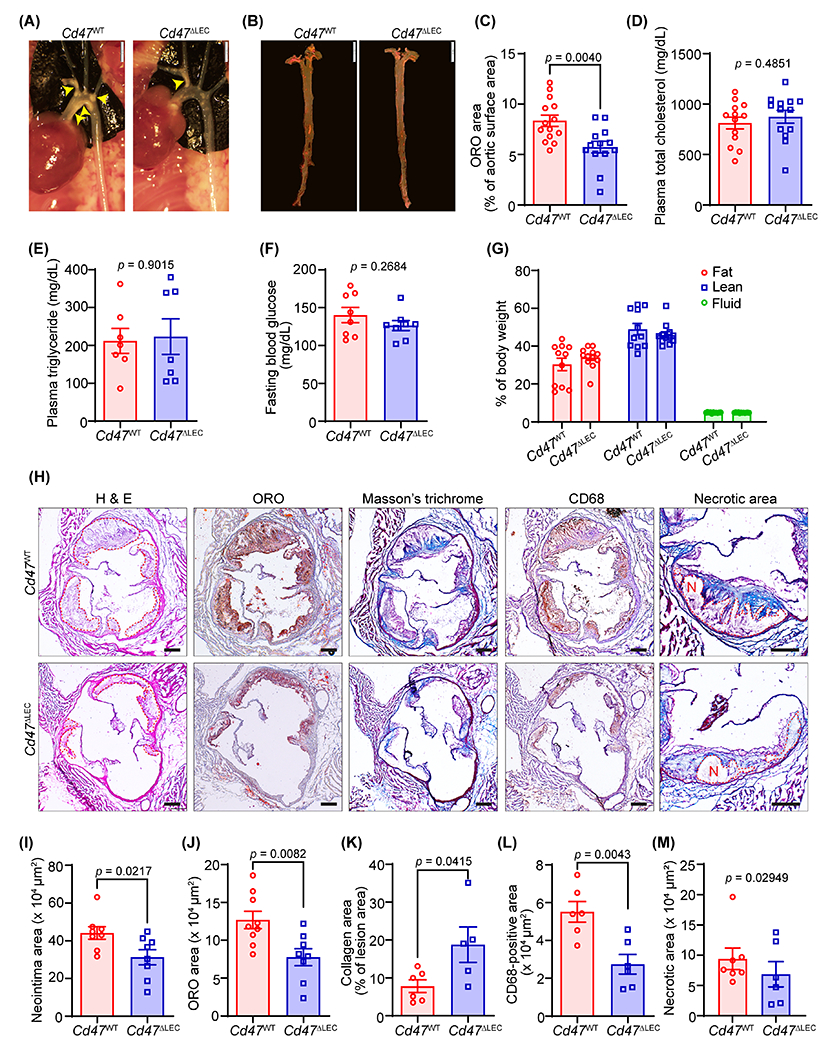
Fig. 5. LEC-specific Cd47 deficiency reduces atherosclerotic lesion formation.

(A-M) Male Cd47WT and Cd47ΔLEC mice were injected with AAV8-PCSK9 i.p., fed a Western diet for 16 weeks and atherosclerosis analyzed. (A) Representative in situ images of aortic arch (yellow arrowheads point to atherosclerotic lesions). Scale bar 2 mm. (B) Representative en face ORO staining of aorta. Scale bar 5 mm. (C) Quantification of plaque area in aorta (n = 13-14). (D-G) Bar diagrams show plasma total cholesterol (D), plasma triglycerides (E), fasting blood glucose levels (F), and body composition (fat, lean, and fluid mass, G) (n = 8-13). (H) Representative images of aortic root cross-sections stained with H & E (neointima area), ORO (lipid accumulation), Masson’s trichrome (collagen content), CD68 (macrophage burden) and necrotic area (encircled in red). Scale bar 200 μm. (I-M) Bar diagrams show neointima area (I), lipid deposition (J), collagen content (K), macrophage accumulation (L), and necrotic area (M) in aortic root sections (n = 5-9). Statistical analyses were performed using a two-tailed unpaired Mann-Whitney test (C, E and M), two-tailed unpaired student t-test (D, F and I-L), and two-way ANOVA followed by Sidak’s post hoc test (G). Data represent mean ± SEM.
