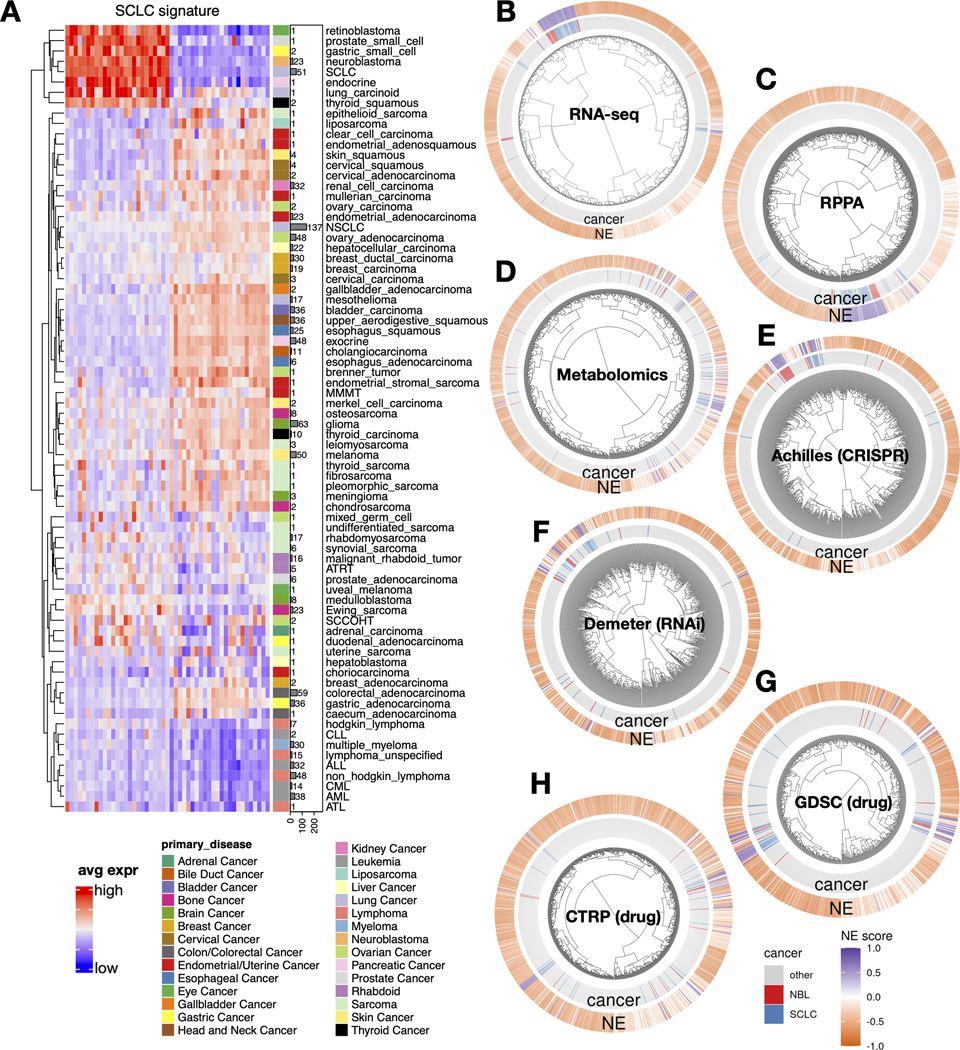
Figure 1. The molecular similarity between NBL and SCLC.

A. SCLC NE signature gene expression across different cancer lineages. The expression of NE (left half) and non-NE (right half) genes were averaged by cancer lineages and plotted as a heatmap. The number of cell lines per lineage are visualized as bars plotted right to the heatmap. Note that SCLC and NBL are the two cancer types with the highest number of cell lines in the cluster with high expression of NE genes. B-H, hierarchical clustering of cell lines by omics and functional screening datasets. 1165 cancer cell lines by expression of 19159 genes (B), 897 lines by 214 RPPA features (C), 926 lines by 225 metabolites (D), 688 lines by CRISPR effect score of 509 genes (E), 648 lines by RNAi effect score of 375 genes (F), 624 lines by 208 compounds from GDSC (G), and 794 lines by 168 compounds from CTRP (H). Note the clustering for RNA-seq data was based on the top 10 principal components, RPPA and metabolomics clusterings were based on all available features; dependency and drug clusterings were based on selected consistent features as previously summarized. Each leaf on the dendrogram represents a cell line. The inner rim right outside the dendrogram signifies the cancer lineage and the outer rim indicates the NE score of the cell line.
