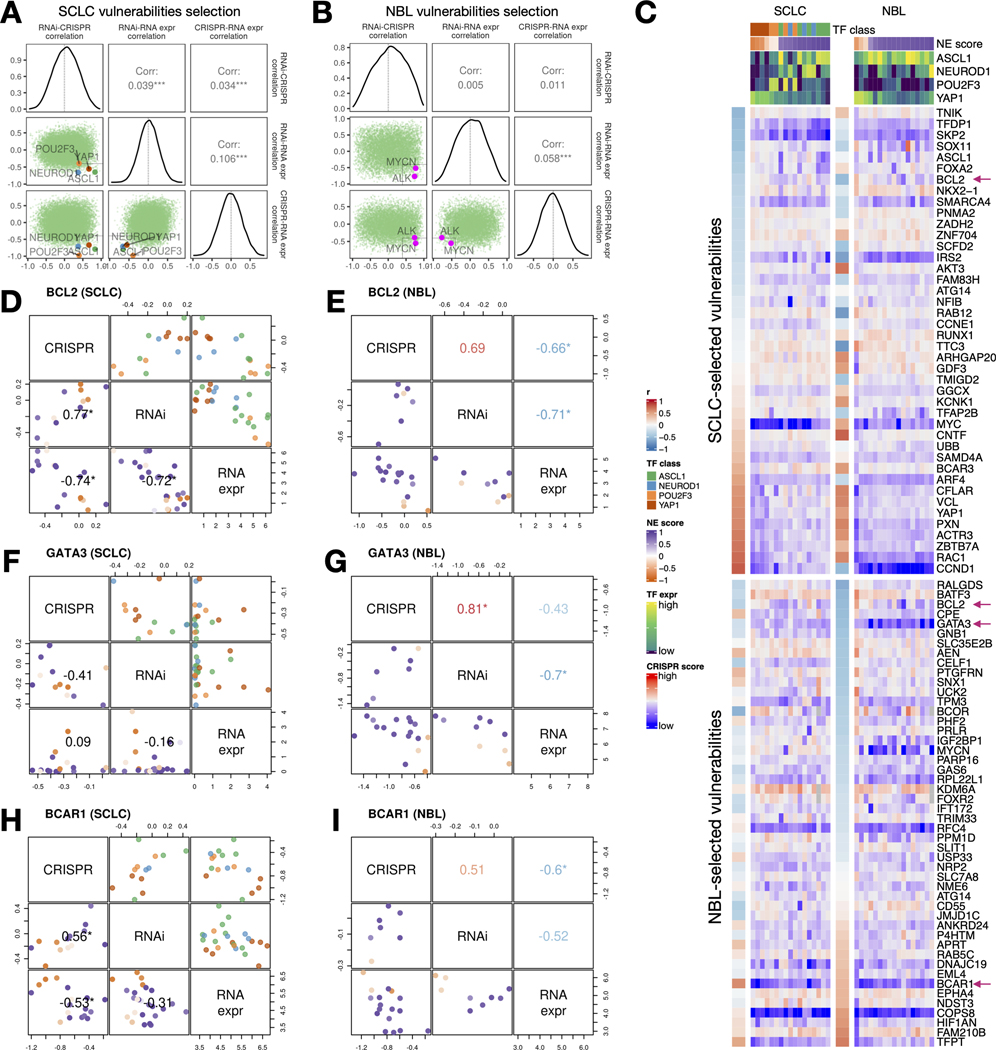
Figure 7. Similar and distinct NE score-associated gene dependencies in SCLC and NBL cell lines.
A-B. Selection of SCLC (A) and NBL (B) vulnerabilities based on the consistency (positive correlation) between CRISPR and RNAi data, and anti-correlation between dependency data and gene expression data. Pearson correlation coefficients from RNAi-CRISPR (left), RNAi-RNA expr (middle), and CRISPR-RNA expr (right) correlations were computed for all genes. The distributions of these coefficients are plotted as diagonal panels; pairwise correlations among these three sets of correlation coefficients were visualized as scatter plots in the lower triangular panels and the Pearson correlation coefficients are printed in the upper triangular panels. The four SCLC subtype driver TFs and the NBL oncogenic driver MYCN all have high consistency between CRISPR and RNAi data and high anti-correlation between dependency data and gene expression data. Areas with r > 0.4 from RNAi - CRISPR correlation, and r < −0.4 from RNAi - RNA expr and CRISPR - RNAi correlation were demarcated by light gray squares. C. Correlation between NE scores and effect scores of selected dependencies in SCLC and NBL. The upper part of the heatmap displays selected vulnerabilities for SCLC and was ordered by correlations between NE scores and the effect scores in SCLC cell lines; likewise, the lower part of the heatmap displays selected vulnerabilities for NBL. Genes with magenta arrows are showcased in D-I. Cell lines are ordered by their NE scores and annotated with NE score and SCLC driver TF expression. D-I, Comparison of selected gene dependencies in SCLC and NBL. In each plot, variable names are shown in the diagonal boxes, and scatter plots display relationships between each pairwise combination of variables. Lower triangular plots are colored by NE scores whereas upper triangular plots for SCLC figures are colored by TF classes. Pearson correlation coefficients are provided in lower triangular boxes for SCLC and upper triangular boxes for NBL. Refer to legends in C for color annotations.

