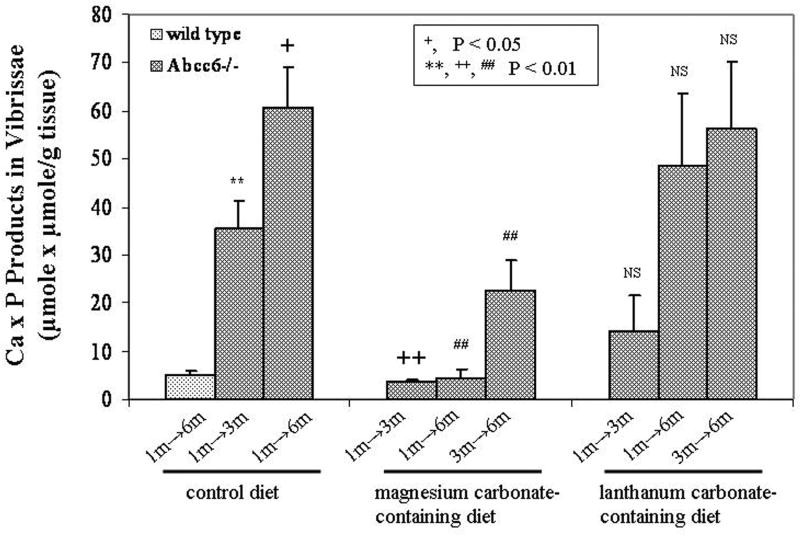
Figure 2. Quantitation of calcium and phosphate in the vibrissae of mice depicted in Fig. 1.
Biopsy specimens were processed as described in the Materials and methods section, and calcium and phosphate were quantitatively determined by chemical assays. The Ca x P product was correlated with the weight of the biopsied tissue. Values are expressed as mean ± S.E. and the statistical significance was determined by Wilcoxon’s test as shown in the inset. Statistical significance: ** = in comparison with wild-type mice; +, ++ = in comparison with three-month old Abcc6-/- mice on control diet; ## = in comparison with six-month old Abcc6-/- mice on control diet; NS, the values are not statistically different from those in age-matched mice on control diet.

