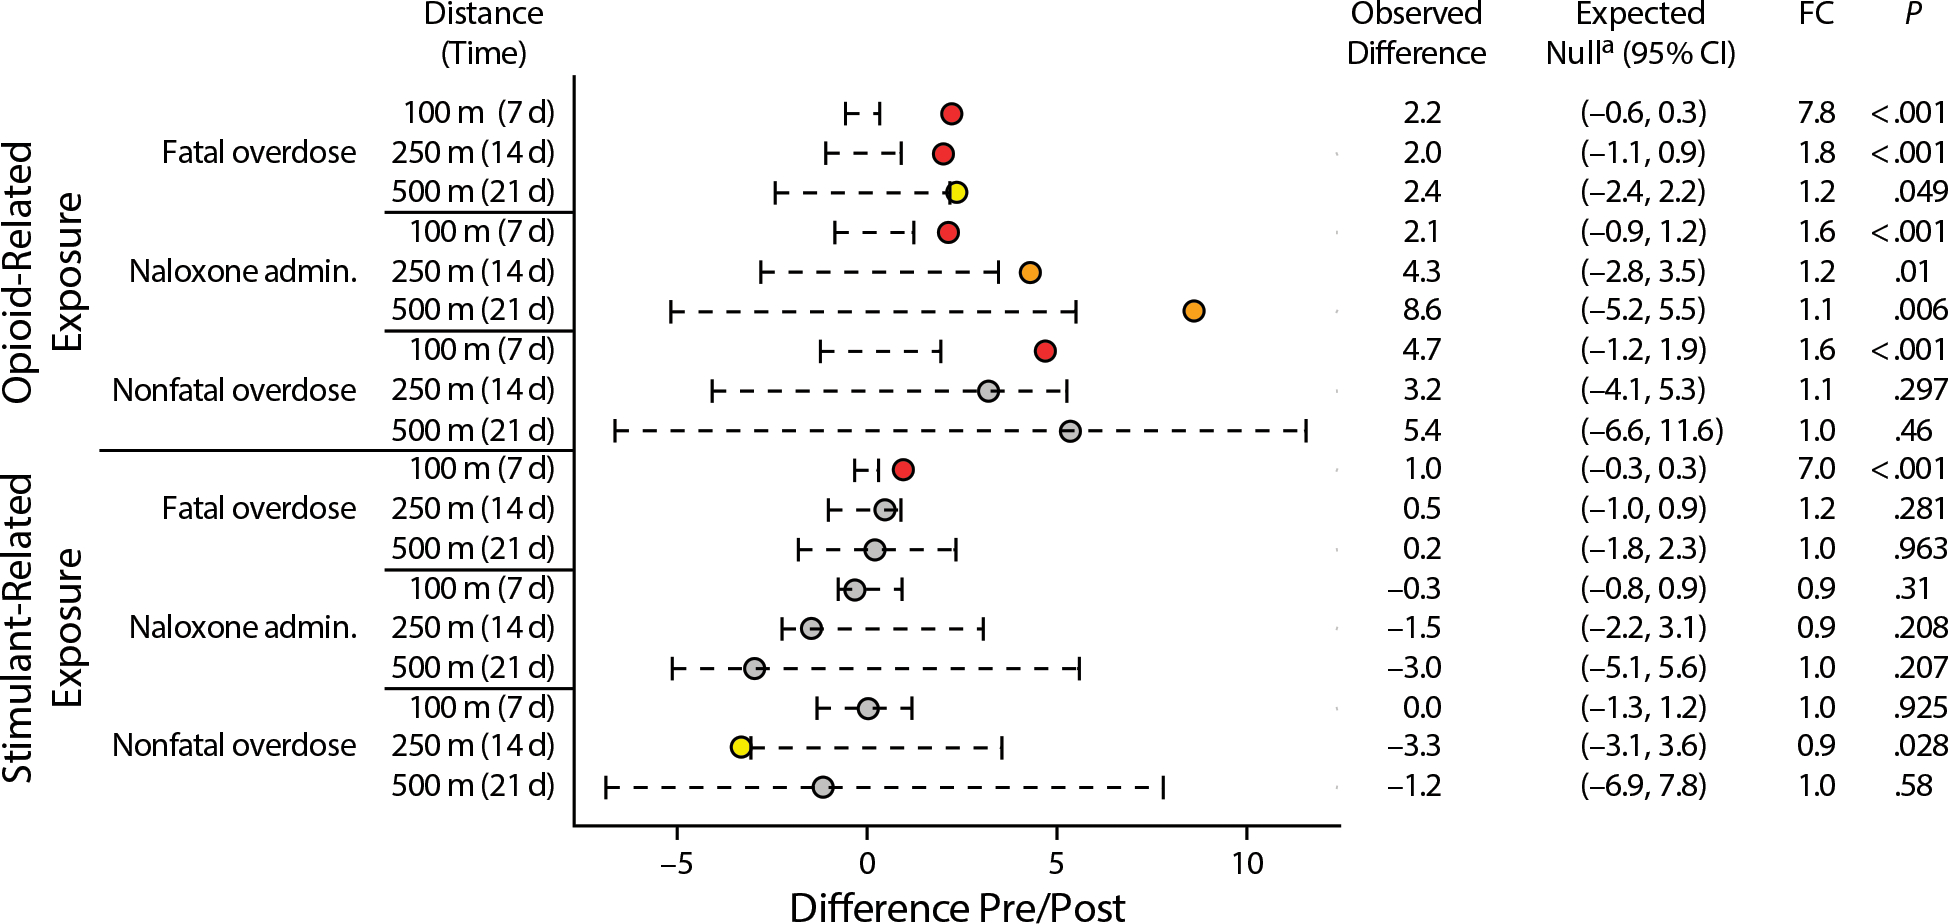
FIGURE 4— Observed vs Expected Pre–Post Differences in Spatiotemporal Associations Between Opioid-Related and Stimulant-Related Drug Seizures and Fatal Overdose, Nonfatal Overdose, and Naloxone Administration Events: Marion County, IN, 2020–2021.

Note. admin 5 administration; CI 5 confidence interval; FC 5 fold change observed vs expected.
aThe observed pre–post difference is compared to the 95% CI for the expected difference estimated under the null distribution.
