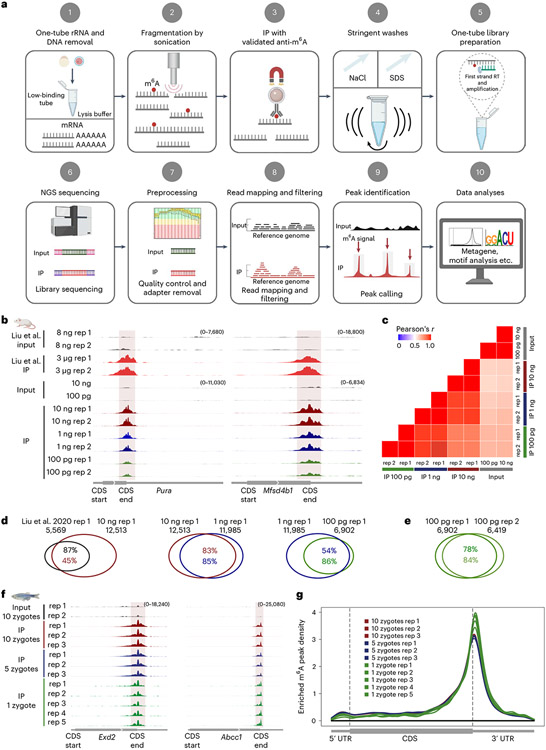
Fig. 1 ∣. Development of picoMeRIP–seq.
a, Schematic of the single-cell MeRIP–seq method and analysis pipeline; RT, reverse transcription; NGS, next-generation sequencing. Figure created with BioRender.com. b, Genome browser snapshots of two transcripts (transcript IDs: ENSMUST00000051301.5 for Pura and ENSMUST00000163705.2 for Mfsd4b1) harboring m6A enrichment near the stop codon. Tracks are shown for picoMeRIP–seq experiments with titration of the starting amount of poly(A)-selected RNA compared to published work starting with 3 μg of total RNA (Liu et al.27). c, Transcriptome-wide correlation analyses (sequencing read coverage). d, Venn diagrams showing overlap of m6A peaks from picoMeRIP–seq experiments and comparison to published work starting with 3 μg of total RNA (Liu et al27). e, Overlap of m6A peaks between two picoMeRIP–seq experiments from 100 pg of poly(A)-selected RNA. f, Genome browser snapshots of zebrafish zygote picoMeRIP–seq for two transcripts (transcript IDs: ENSDART00000111389 for Exd2 and ENSDART00000161897 for Abcc1) harboring m6A enrichment near the stop codon. g, Metagene profiles for zebrafish zygote picoMeRIP–seq showing the enrichment of m6A peaks along protein-coding gene transcripts.

