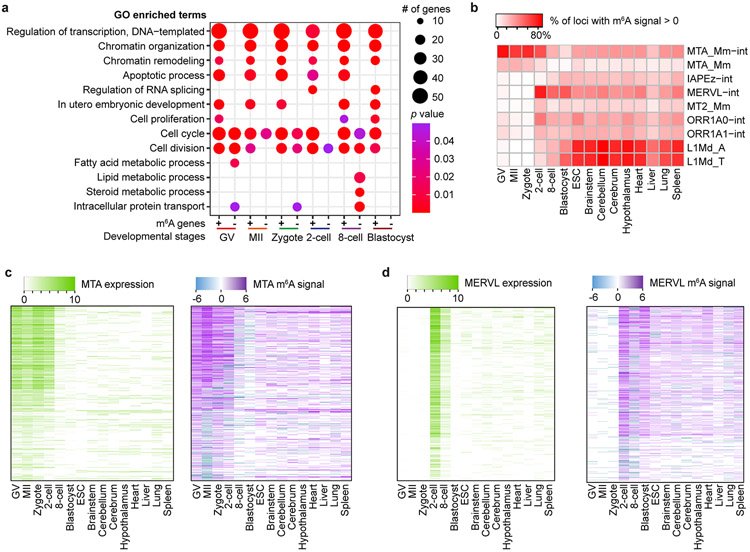
Extended Data Fig. 9 ∣. GO analysis and enrichment of m6A on retrotransposon-derived RNAs in mouse oocytes and embryos.
a, Gene Ontology (GO) analysis for m6A-marked transcripts (+) and for transcripts not marked by m6A (−). The modified Fisher exact p values were (that is EASE score) reported by DAVID (see https://david.ncifcrf.gov/helps/functional_annotation. html). b, Enrichment of m6A in transcripts from selected retrotransposon subfamilies shown for mouse oocytes, embryos, ES cells (ESCs) and eight mouse tissues. MeRIP-seq data for mouse tissues are from Liu et al.27. c, d, Expression and m6A signal profiles across the internal sequences of MTA (c); and MERVL (d). The expression is RPKM calculated by deepTools (see Methods).

