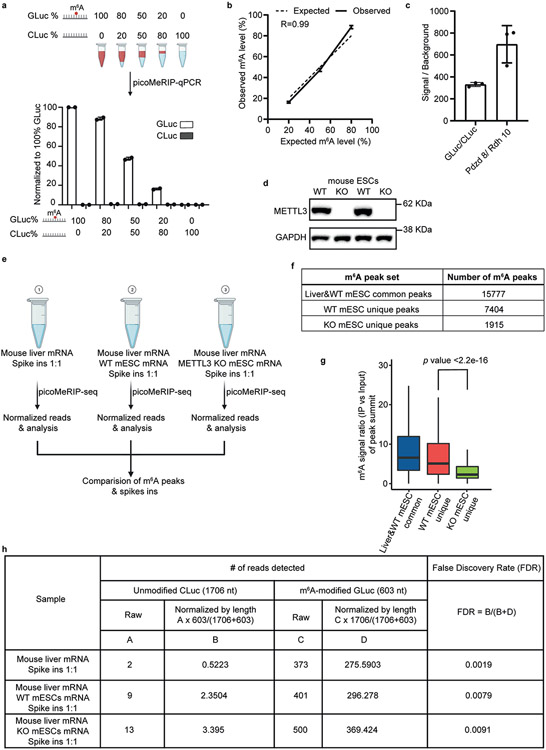
Extended Data Fig. 4 ∣. Characterization of specificity and background of picoMeRIP.
a, Top panel, schematic illustration of experimental setup for titration of two control RNAs, m6A-modified GLuc, and unmodified CLuc, for picoMeRIP and qPCR assessment. Bottom panel, quantified immunoprecipitation levels of m6A-modified GLuc, and unmodified CLuc, after picoMeRIP. picoMeRIP signal was normalized to 100% GLuc. Data are presented as mean ± SD values, with n = 2 independent experiments for each experimental condition. Created with BioRender.com. b, Experimentally observed m6A levels of m6A-modified control RNA as compared to the expected ones based on the titration experiment described in panel a. Data are presented as mean ± SD values, with n = 2 independent experiments for each experimental condition. R is the correlation coefficient in regression analysis. c, qPCR assessment of picoMeRIP m6A signal over background with two control RNAs used as spike-ins, m6A-modified GLuc, and unmodified CLuc, and for the previously validated m6A positive (Pdzd8) and negative (Rdh10) liver transcripts. Data are presented as mean ± SD values, with n = 3 independent experiments for each experimental condition. d, Western blot of METTL3 and GAPDH for WT and Mettl3 deficient (“knock-out” (KO)) mES cell lines. GAPDH was used as loading control. Two independent western blot experiments were performed with similar results. e, Schematic illustration of experimental setup to compare number of m6A peaks and peak signal strength of picoMeRIP-seq from WT and Mettl3 deficient (KO) mES cells, including spiked-in control RNAs. Mouse liver mRNA and mES cell mRNA were added in a 1:1 ratio. Two control RNAs were used as spike-ins, m6A-modified GLuc, and unmodified CLuc, and added at a 1:1 ratio. Created with BioRender.com. f, Number of picoMeRIP-seq m6A peaks uniquely identified in WT and Mettl3 deficient (KO) mES cells, and co-identified in mouse liver and WT mES cells. g, Box plots of m6A signal for comparison of picoMeRIP-seq peaks uniquely identified in WT and Mettl3 deficient (KO) mES cells. Middle vertical line (bold) depicts the median, and the 25th percentile to 75th percentile is shown. Whiskers extend to the most extreme data point within 1.5 interquartile range of the quartiles. The p value was calculated using a Wilcoxon rank sum test (two-sided). The corresponding m6A peak numbers for each of three groups are shown in panel f. h, Assessment of false discovery rate of picoMeRIP-seq by spike-in m6A-modified GLuc, and unmodified Cluc control RNAs.

