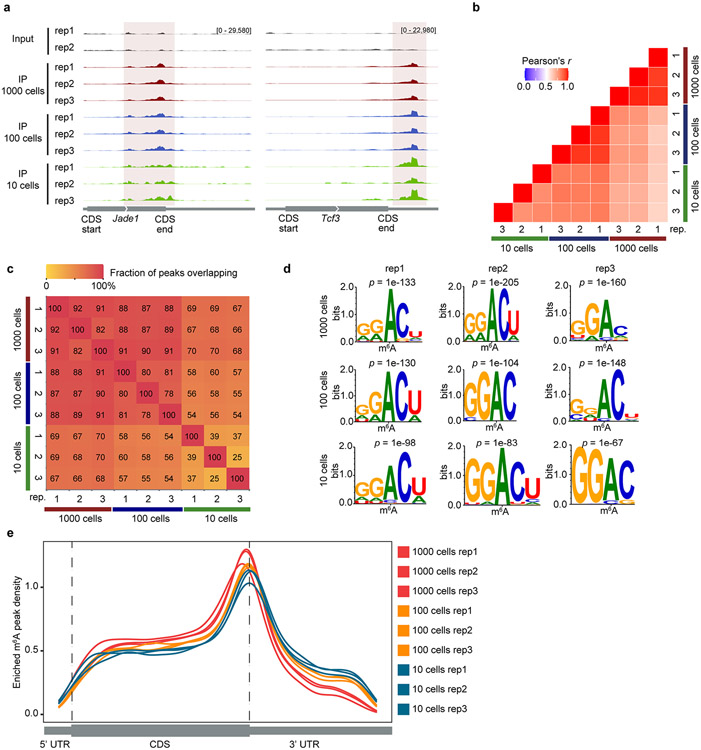
Extended Data Fig. 7 ∣. picoMeRIP-seq from FACS sorted mouse ES cells.
a, Genome browser snap shots of two transcripts with m6A enrichment (transcript ID: ENSMUST00000026865.14 for Jade1, ENSMUST00000105344.7 for Tcf3). b, Transcriptome-wide correlation analyses (sequencing read coverage) between picoMeRIP-seq experiments from 1,000, 100 and 10 mouse ES cells. c, Heatmap showing fraction of overlap of m6A peaks between picoMeRIP-seq experiments with 1,000, 100 and 10 mouse ES cells. Peaks identified in the samples indicated at the bottom of the plot were used as the reference when calculating fraction of overlap of peaks from samples indicated at the left side of the plot. d, Consensus motifs identified within m6A peaks from picoMeRIP-seq experiments with 1,000, 100 and 10 mouse ES cells. e, Metagene profiles showing the enrichment of m6A peaks along protein-coding gene transcripts for 1,000, 100 and 10 mouse ES cells.

