Figure 1.

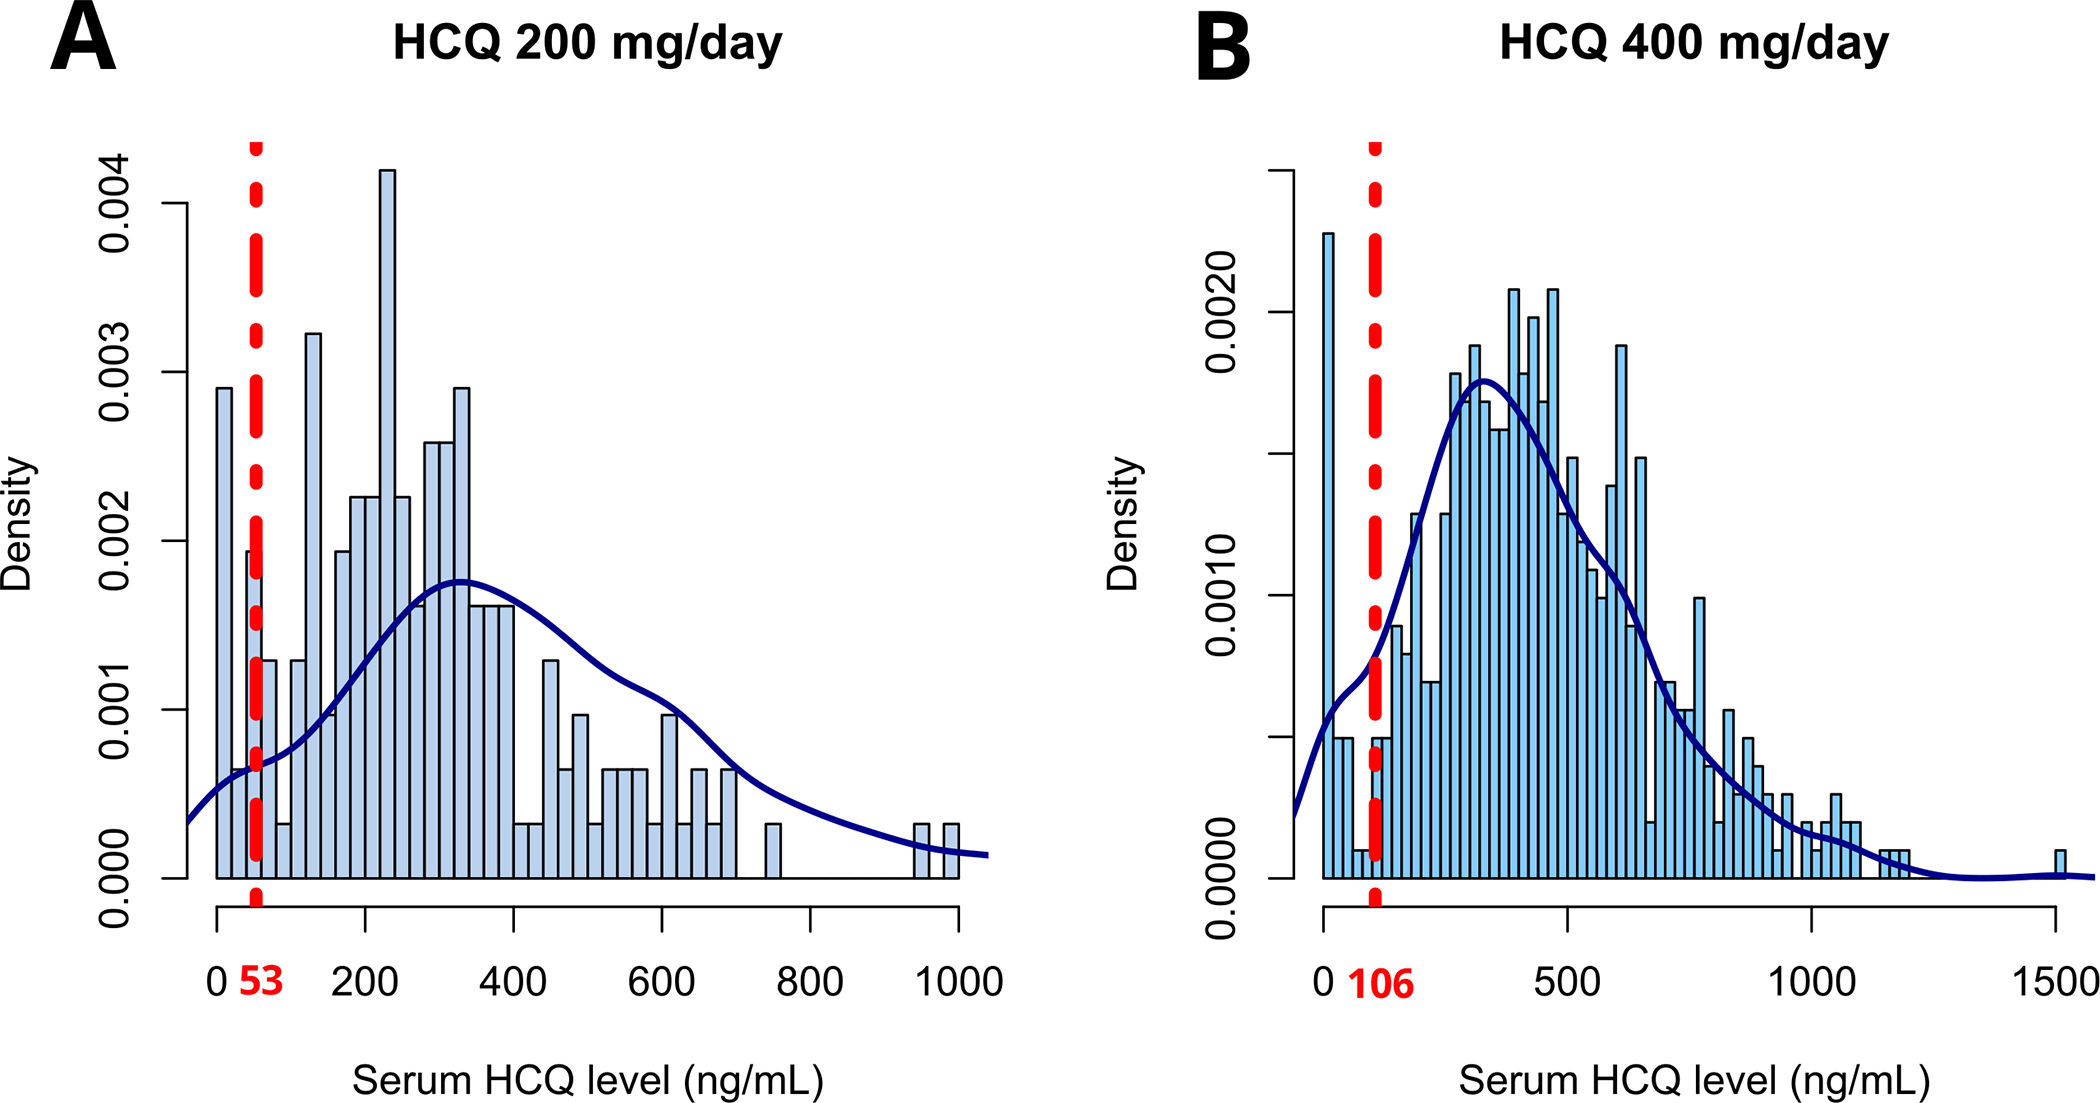
Distribution of serum hydroxychloroquine levels according to daily prescribed dose (A: 200 mg/day; B: 400 mg/day). The red dotted lines represent thresholds for severe non-adherence to hydroxychloroquine (A: 53 ng/ml; B: 106 ng/ml).

Distribution of serum hydroxychloroquine levels according to daily prescribed dose (A: 200 mg/day; B: 400 mg/day). The red dotted lines represent thresholds for severe non-adherence to hydroxychloroquine (A: 53 ng/ml; B: 106 ng/ml).