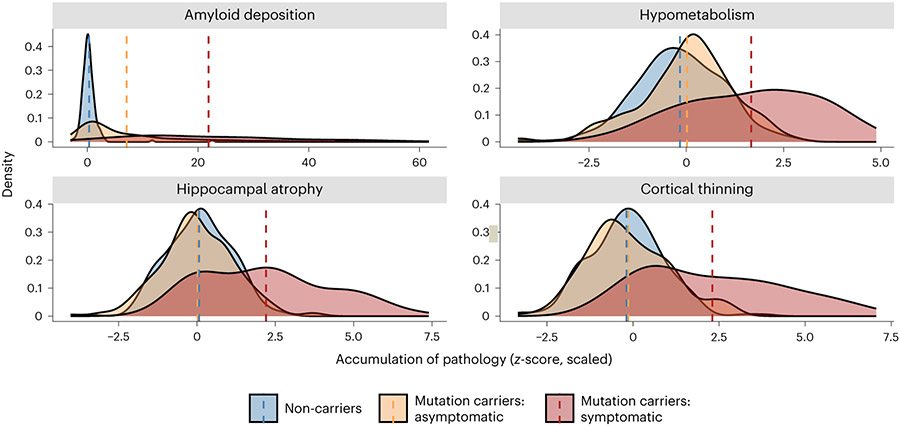
Fig. 2 ∣. Summary depiction of the results of the analyses performed on the PiB-PET (n = 484), FDG-PET (n = 494) and T1w MRI (n = 534) images.
Distributions represent the average accumulation of each major pathology that is present across groups at baseline visit. All z-scores were calculated relative to unimpaired mutation non-carriers. Dashed lines represent mean scores. No statistical tests are depicted, but a full breakdown of differences in these metrics is presented in the Results as well as in Extended Data Table 1 and Extended Data Fig. 2. In all cases, these distributions suggest that symptomatic mutation carriers (red) have higher levels of pathology than asymptomatic carriers (yellow) and non-carriers (blue). Aβ deposition represents averaged PiB-SUVR extracted from the lateral orbitofrontal, mesial orbitofrontal, rostral mesial frontal, superior frontal, superior temporal, mesial temporal and precuneus; hypometabolism represents the average FDG-SUVR extracted from the isthmus cingulate and inferior parietal regions; cortical thinning was derived from cortical thickness values averaged across the lateral orbitofrontal, mesial orbitofrontal, rostral mesial frontal, superior frontal, superior temporal, mesial temporal and precuneus; and hippocampal atrophy represents average hippocampal volume. Plot demographics: average age = 38.7 years; proportion females = 56%.

