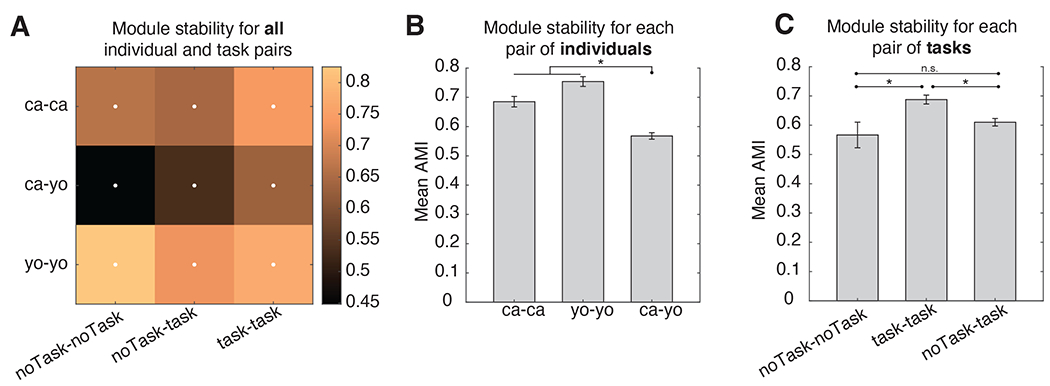
Figure 5. Behavioral modularity is both shared and unique.

(A) Mean module similarity (quantified via the adjusted Mutual Information (AMI) score) across datasets with the same or different subjects, and same or different task demands. White dots denote significant cells (randomization test, p<0.05, multiple comparison corrected). There is significant module overlap both between datasets of the same subject, and that of different subjects. (B) Comparison of module stability either within the same individuals (green) or across different individuals (between), where the effect of task has been partialled out. (C) Same as (B) but comparing module stability across different tasks, either task OFF-OFF (orange) or task ON-ON (blue) comparisons. The effect of individuals has been partialled out. (D) Mean+ SEM of module stability comparing task ON-ON (blue) or task OFF-OFF (orange) pairs, after partialling out the effect of individual. Black lines and dots denote significant differences (multiple comparisons corrected). The mean cutoff that maximized modularity is depicted in red.
