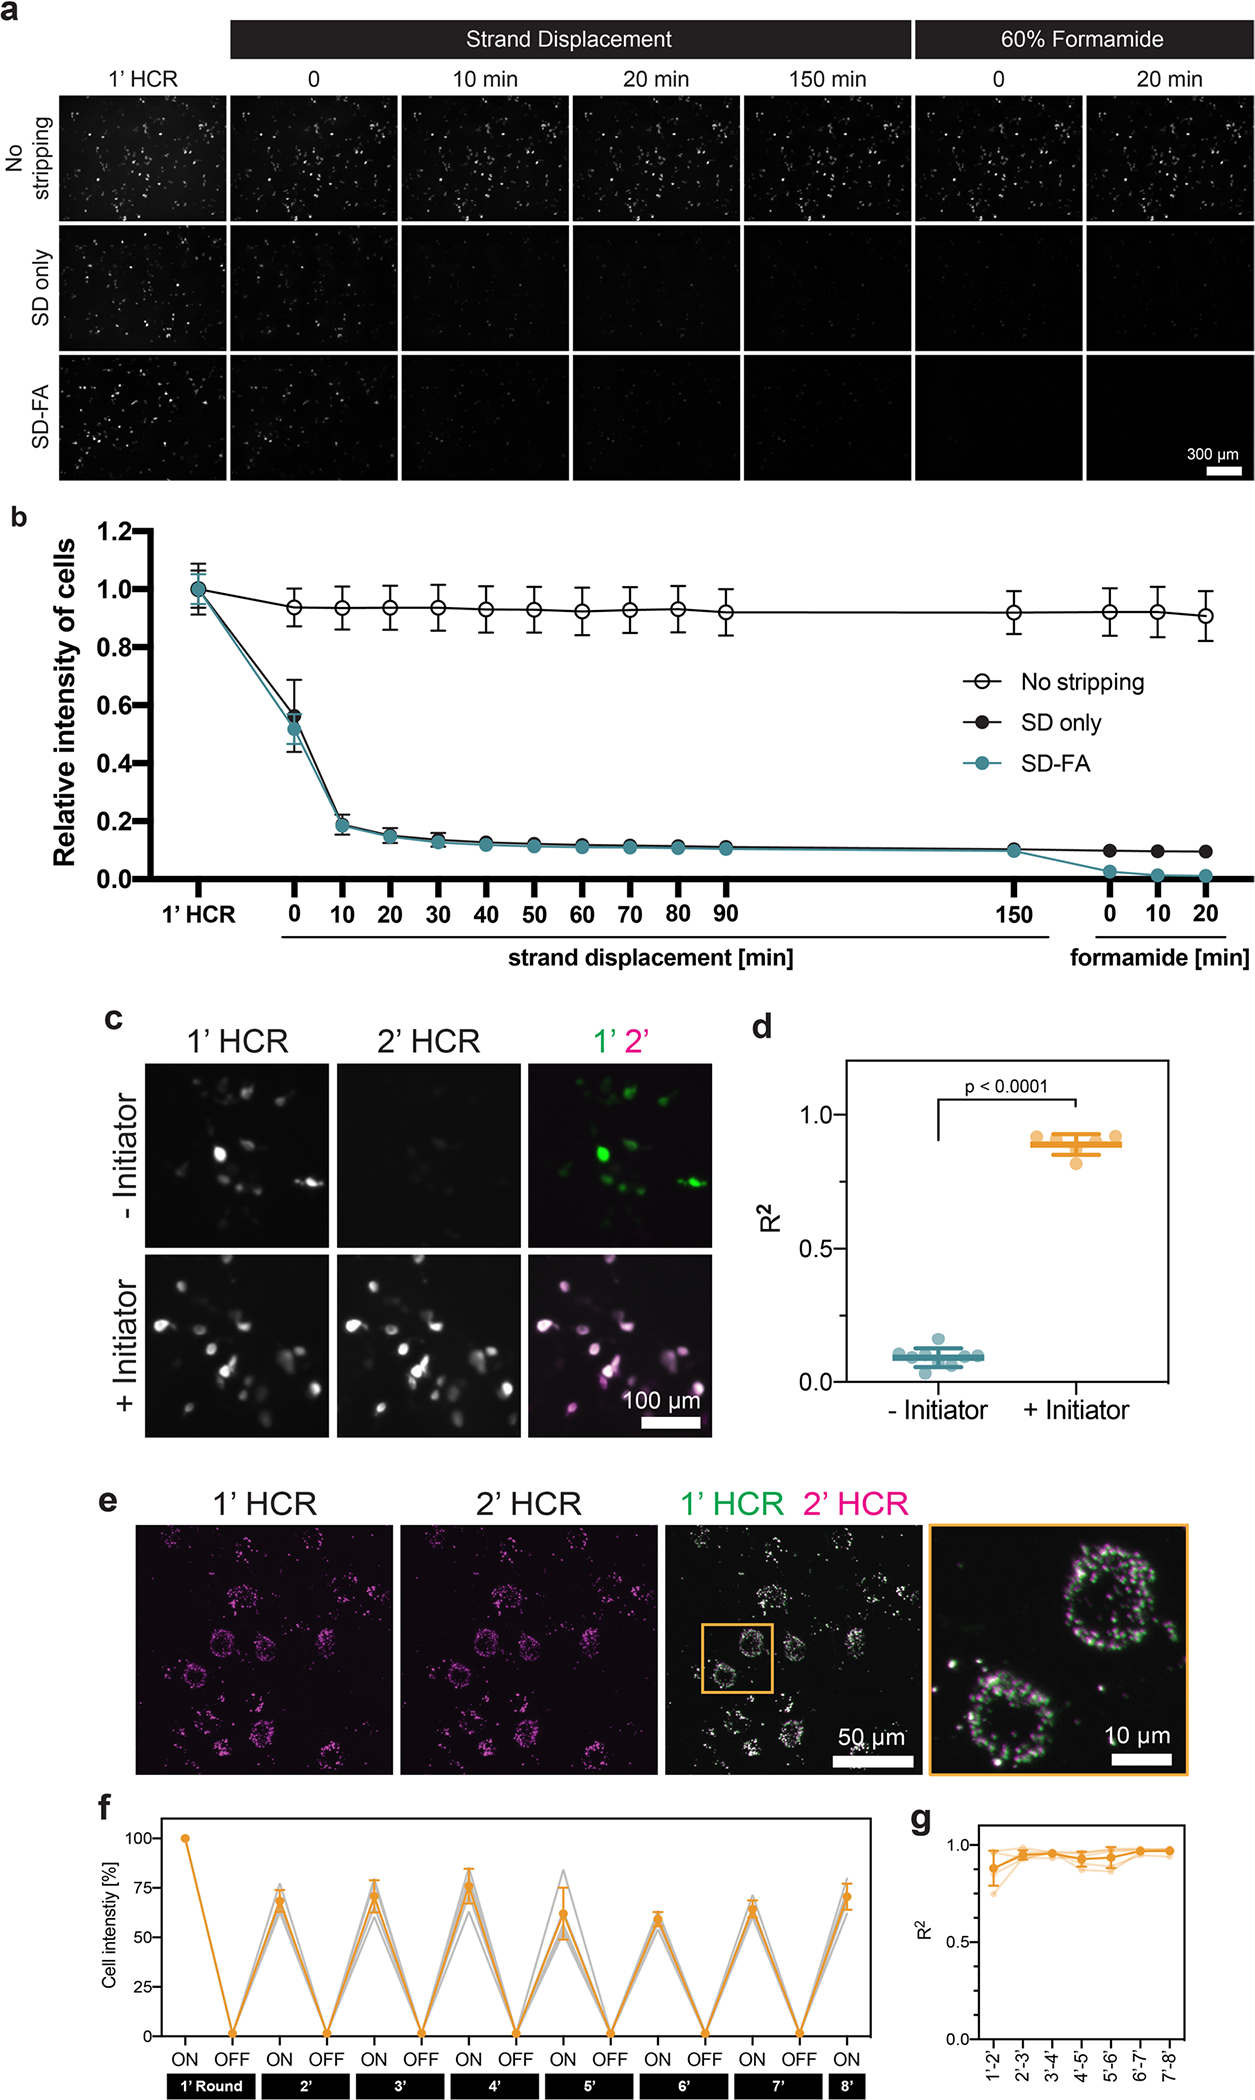
Extended Data Fig. 3 |. Validation of two-step stripping method.

a, Representative images of the RNA signals of the barcode transfected into HEK293T cells and detected by RCAHCR (1’ HCR). Following 1’ HCR, we divided the samples into three groups: (1) no stripping, (2) only hairpin disassembly via strand displacement (SD only) and (3) hairpin disassembly via strand displacement and initiator detachment via formamide treatment (SD-FA). While proceeding with each step, we time-lapse imaged the samples after hairpin disassembly via strand displacement (‘Strand Displacement’), followed by initiator detachment with formamide (‘60% formamide’). b, Relative cell intensity of no-stripping, SD-only, and SD-FA samples in a after each step (n = 3; mean ± s.d.). c, Representative images of the RNA signals from the barcode after the first (1’ HCR) and second round of HCR (2’ HCR) with the same initiators and hairpins (+Initiator) or only the hairpins (−Initiator). d, The coefficient of determination (R2) between 1’ HCR and 2’ HCR in c (mean ± s.d.; two-sided unpaired t-test; n = 9 for ‘−Initiator’; n = 6 for ‘+Initiator’). e, In situ labeling of Gad1 with RCAHCR amplification in mouse cortex (1’ HCR) and re-detection (2’ HCR) after two-step stripping. f, Relative cell intensity over eight rounds of the same barcode detection (used in a) in cell culture (n = 5; mean ± s.d.). g, The coefficient of determination (R2) between each round during the eight rounds of repeated labeling in f (n = 5; mean ± s.d.).
