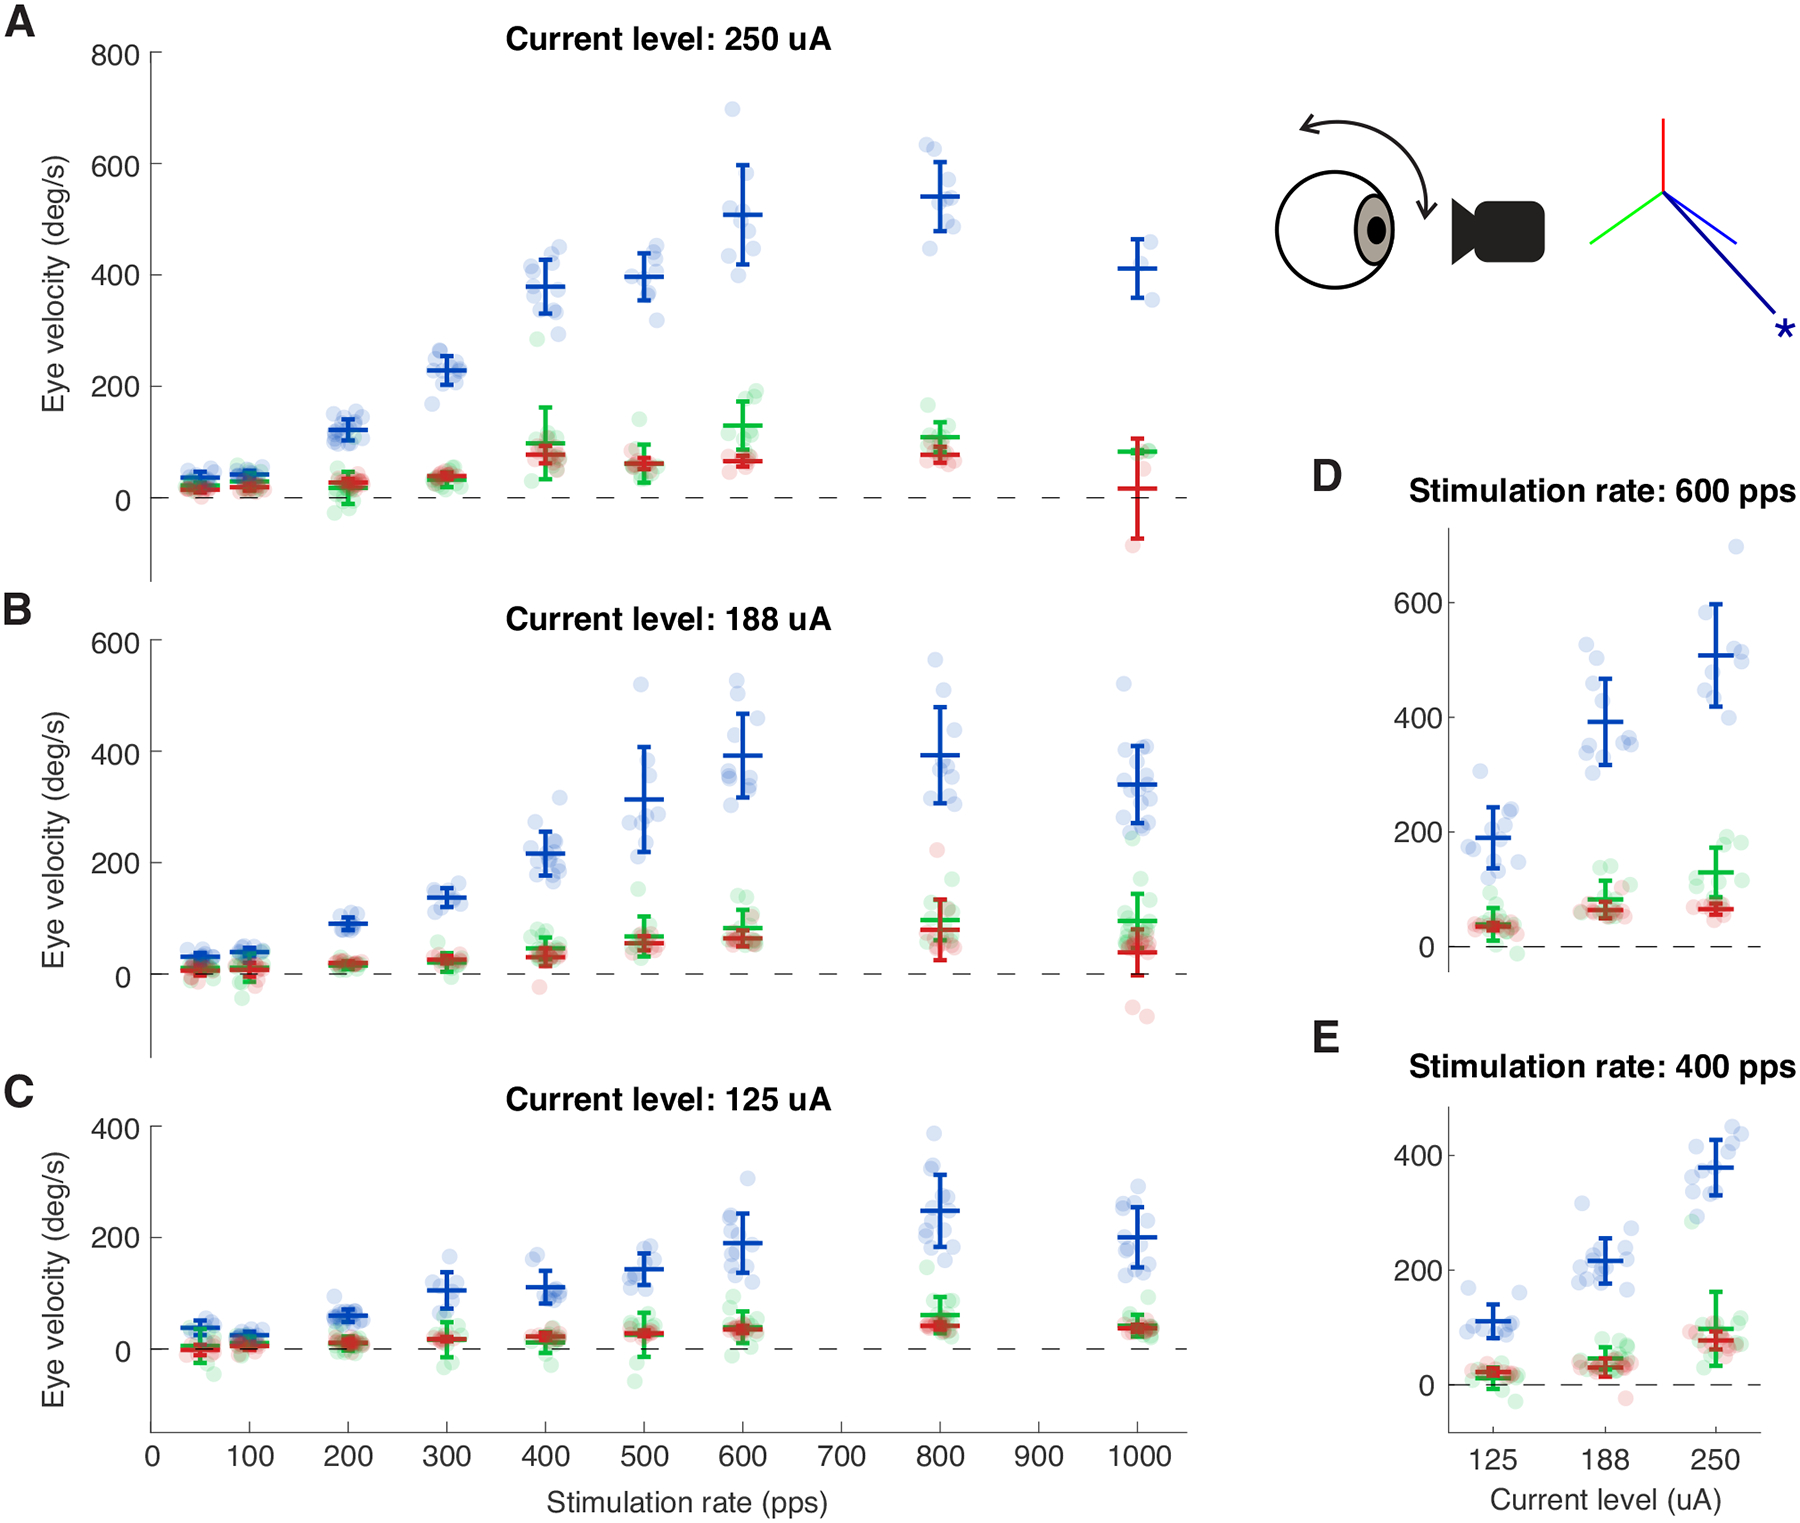
Fig3:

Evoked VOR eye movements show quasilinear relationship as the stimulation rate and the current amplitude increase. A-C) Evoked VOR eye velocity as a function of stimulation rate using 250, 188, and 125 uA respectively. D-E) Evoked eye velocity as a function of current amplitude using 600 and 400 pps, respectively. Inset shows the vector representation of the response of the electrode pair used. Error bars show one standard deviation. Blue, green, and red signify the directions of the -RALP, -LARP, and Z/LHRH, respectively.
