
Figure 2. Calcium transients induced by mFOE in cultured primary neurons.
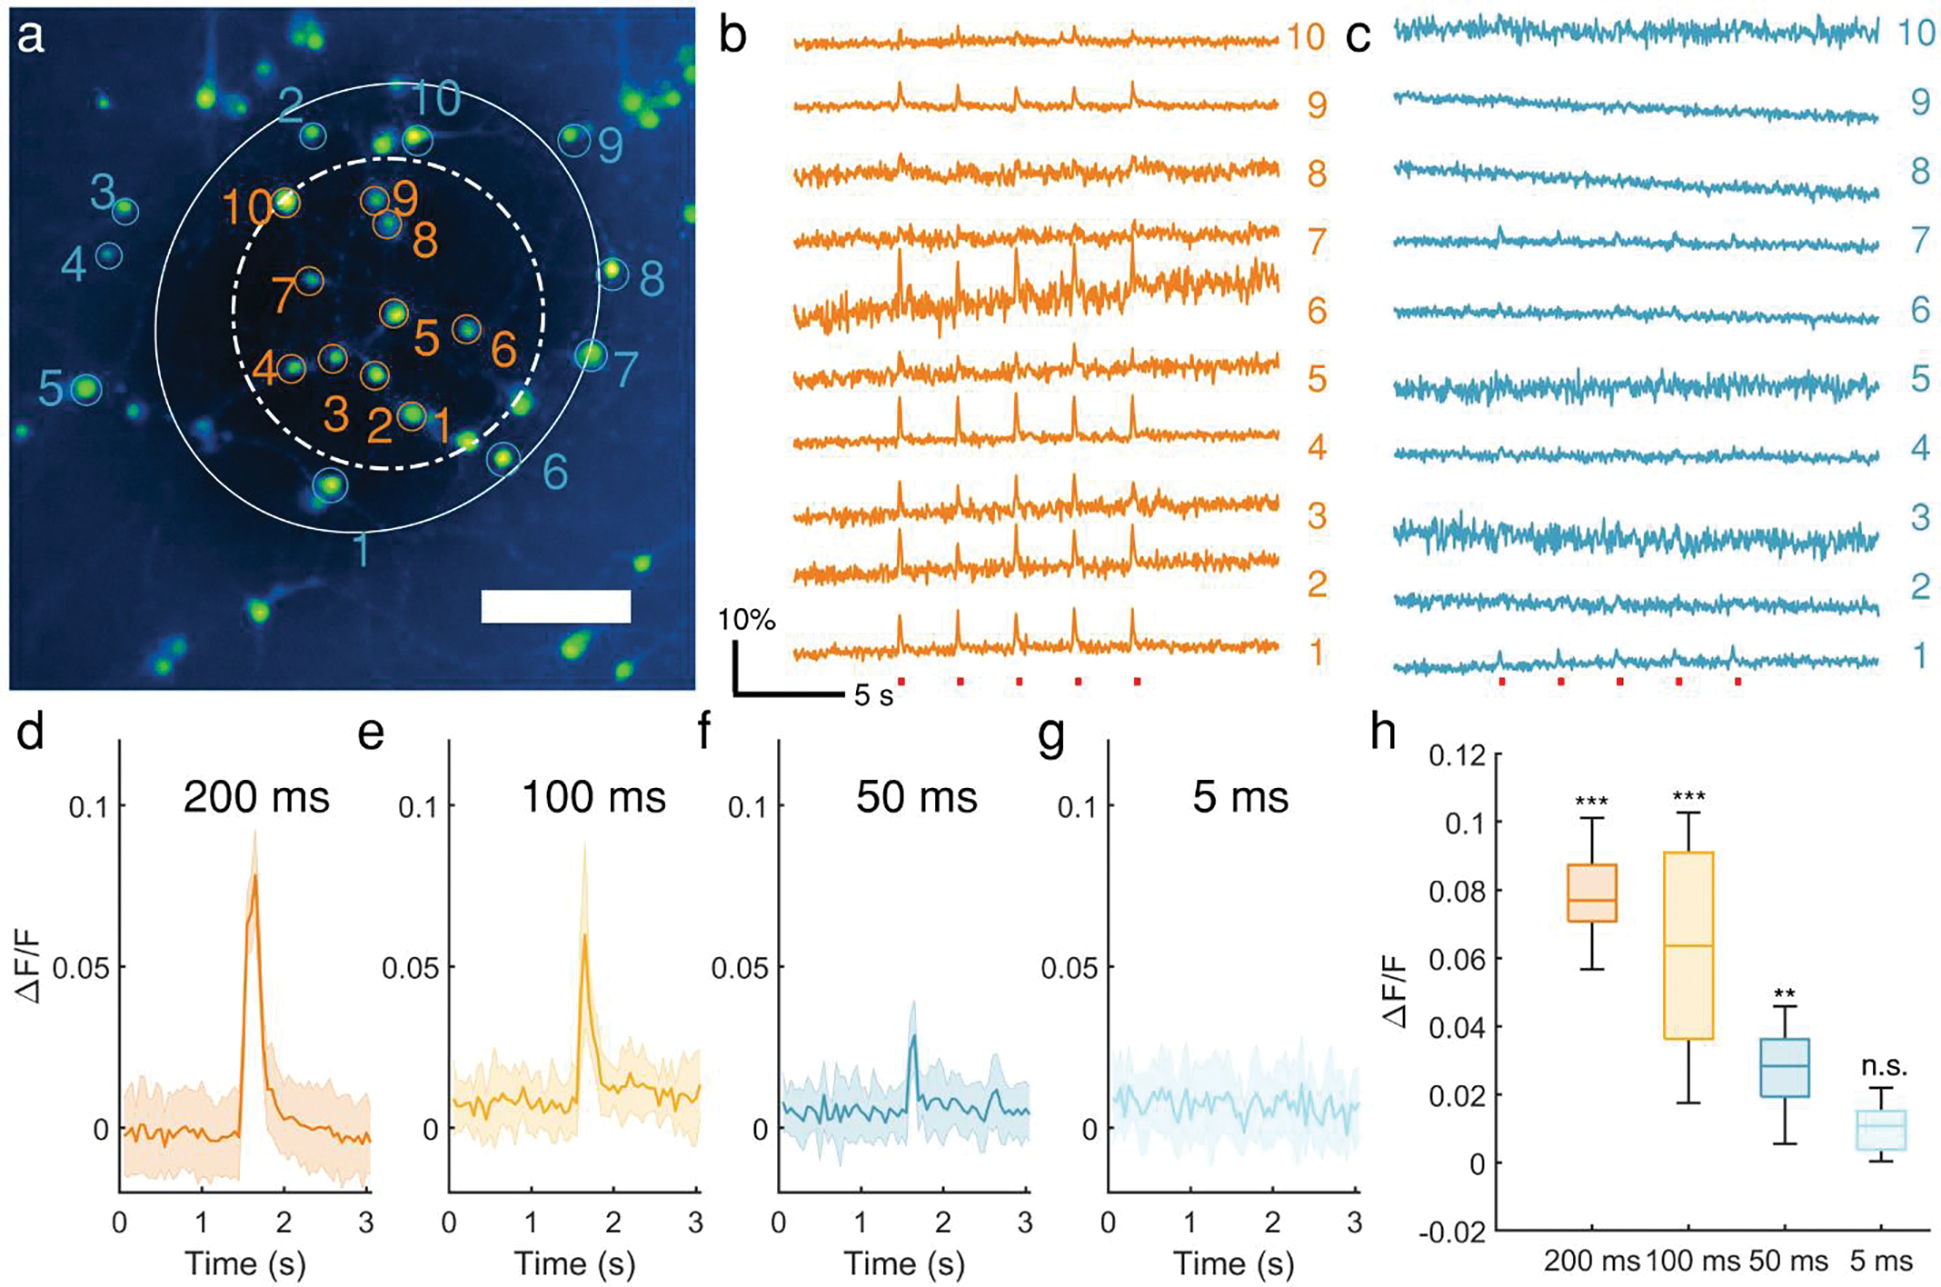
a. Calcium image of primary cultured neurons loaded with OGD-1. Twenty neurons within (orange) and outside (blue) the optoacoustic converter area are circled and labelled. Scale bar: 100 μm. Solid circle: area outside the converter area; dashed line circle: area within the optoacoustic converter area. b-c. Calcium traces of neurons undergone repeated mFOE stimulations with a laser pulse train duration of 100 ms (red dots). Each pulse train was repeated 5 times. Colors and numbers of the traces are corresponding to the neurons labelled in a. d-g. Average calcium traces of neurons triggered by mFOE stimulation with durations of 200 ms (d), 100 ms (e), 50 ms (f) and 5 ms (g), respectively. Shaded area: the standard deviation (SD). N=15 h. Average maximum ΔF/F of neurons stimulated by mFOE. N = 15. (n.s.: non-significant, p > 0.05; *: p < 0.05; **: p < 0.01; ***: p < 0.001, One-Way ANOVA and Tukey’s mean comparison test)