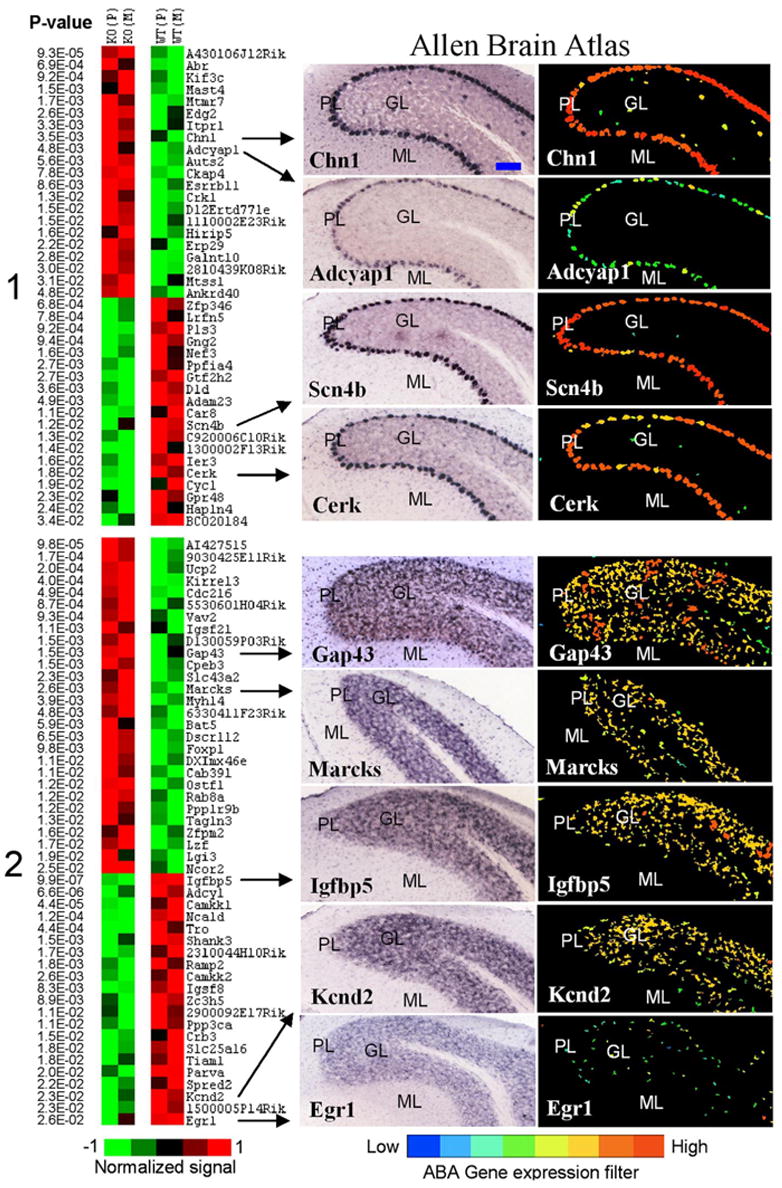
Figure 4.

Cerebellum-specific genes with Purkinje and granule patterns of expression. Left, Differential expression between knock-out (KO) and wild-type (WT) lines is shown in pseudocolor with associated p values from a t test. Average values for Pittsburgh (P) and Merck (M) lines are shown for Purkinje-enriched (cluster 1) and granule-enriched (cluster 2) genes. Genes that show a distinct pattern of expression in Golgi cells of granule layer (for example, see Fig. 1) were excluded from cluster 2. Right, ABA images show regional distribution of nine selected transcripts. ML, Molecular layer; PL, Purkinje cell layer; GL, granule layer; DCN, deep cerebellar nuclei. Several genes with known patterns of expression in cerebellar tissue were present in their corresponding clusters: for example, IP3R (Itpr1) and Scn4b in Purkinje cells, and Igfbp5 and Kcnd2 in granule neurons. Most transcripts were also expressed to some extent in the DCN. The blue bar in the top left image represents ~100 μm. All images are copied and modified with permission from Allen Institute for Brain Science.
