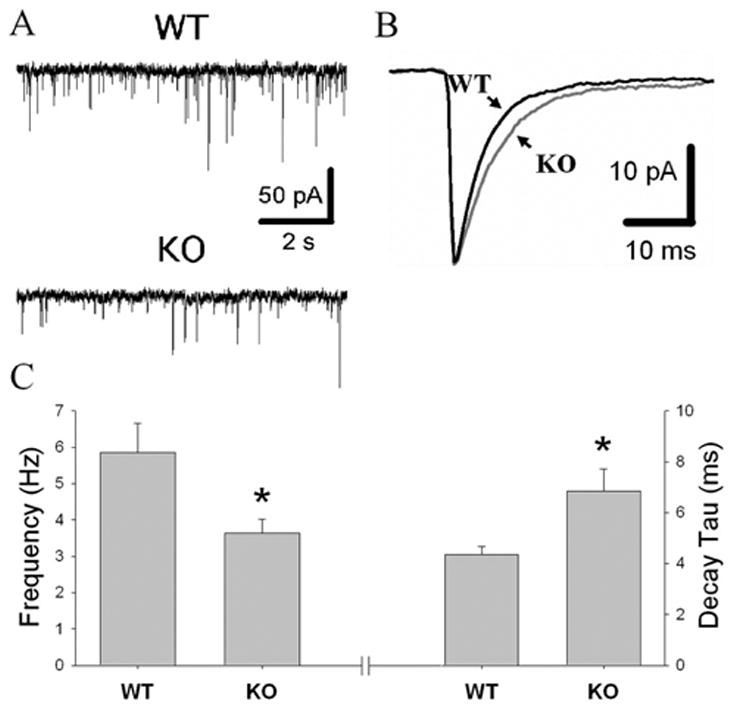
Figure 7.

Electrophysiological results. A, Representative traces of GABAA mIPSCs in knock-out (KO) and wild-type (WT) mice. B, Average mIPSCs from representative WT and KO neurons. GABAA α1 KO mice exhibited mIPSCs with longer decay times (C, right) and a reduction in GABA release as measured by the frequency of mIPSCs (C, left) in midbrain DA neurons (n = 4 –5 for each genotype; *p < 0.05). Average mIPSC amplitude was similar for the KO and WT mice (not shown).
