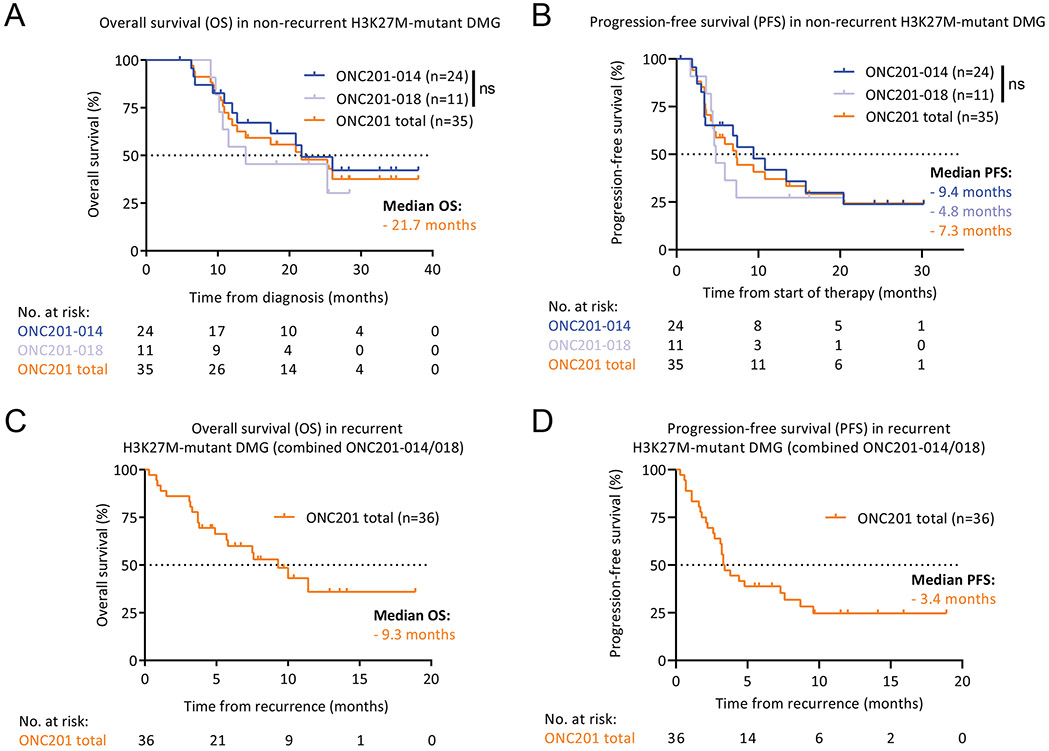
Fig. 1. Survival outcomes of trial patients with H3K27M-DMG treated with ONC201.
(A) Kaplan-Meier curve (Y-axis, % OS; X-axis, time in months) showing OS from diagnosis for non-recurrent H3K27M-DMG patients treated with ONC201 by study (ONC201-014, blue, n=24; ONC201-018, light blue, n=11; and ONC201-014/018 combined, orange, n=35).
(B) Kaplan-Meier curve (Y-axis, % PFS; X-axis, time in months) showing PFS from start of therapy for non-recurrent H3K27M-DMG patients treated with ONC201 by study (ONC201-014, ONC201-018, and ONC201-014/018 combined).
(C) Kaplan-Meier curve (Y-axis, % OS; X-axis, time in months) showing OS from recurrence for recurrent H3K27M-DMG patients treated with ONC201 (ONC201-014/018 combined, orange, n=36).
(D) Kaplan-Meier curve (Y-axis, % PFS; X-axis, time in months) showing PFS from recurrence for recurrent H3K27M-DMG patients treated with ONC201 (ONC201-014/018 combined).

