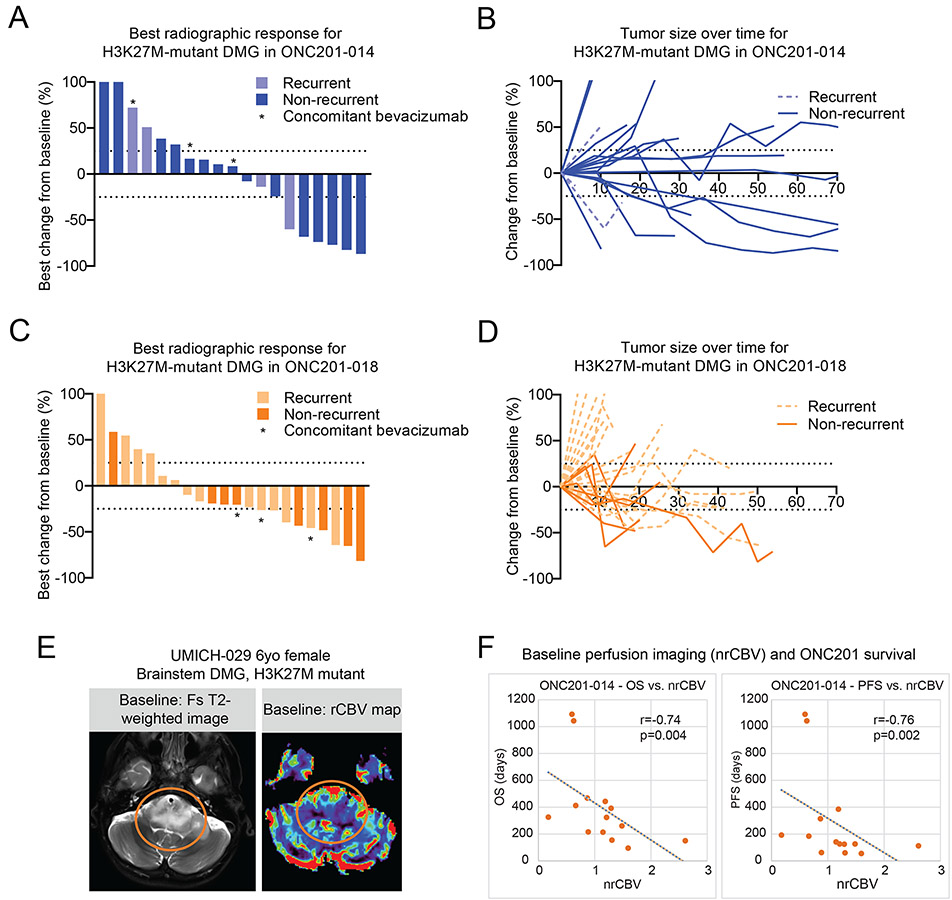
Fig. 2. Radiographic assessment of trial patients with H3K27M-DMG treated with ONC201.
(A-B) Waterfall (A) and spider (B) plots representing radiographic response to ONC201 for patients with H3K27M-DMG from ONC201-014 (n=4, recurrent, light blue; and n=15, non-recurrent, blue). Waterfall plot shows best change from baseline in tumor burden (Y-axis) by RANO-HGG.
(C-D) Waterfall (C) and spider (D) plots representing radiographic response to ONC201 for patients with H3K27M-DMG from ONC201-018 (n=14, recurrent, light orange; and n=8, non-recurrent, orange). Waterfall plot shows best change from baseline in tumor burden (Y-axis) by RANO-HGG.
(E) Representative dynamic susceptibility contrast perfusion MRI images from UMICH-029 (non-recurrent brainstem H3K27M-DMG; post-radiation).
(F) Correlation between normalized relative cerebral blood volume (X-axis, nrCBV) versus OS (left) or PFS (right) in H3K27M-DMGs from ONC201-014 (n=14). Spearman’s correlation coefficient R and P value are indicated.

