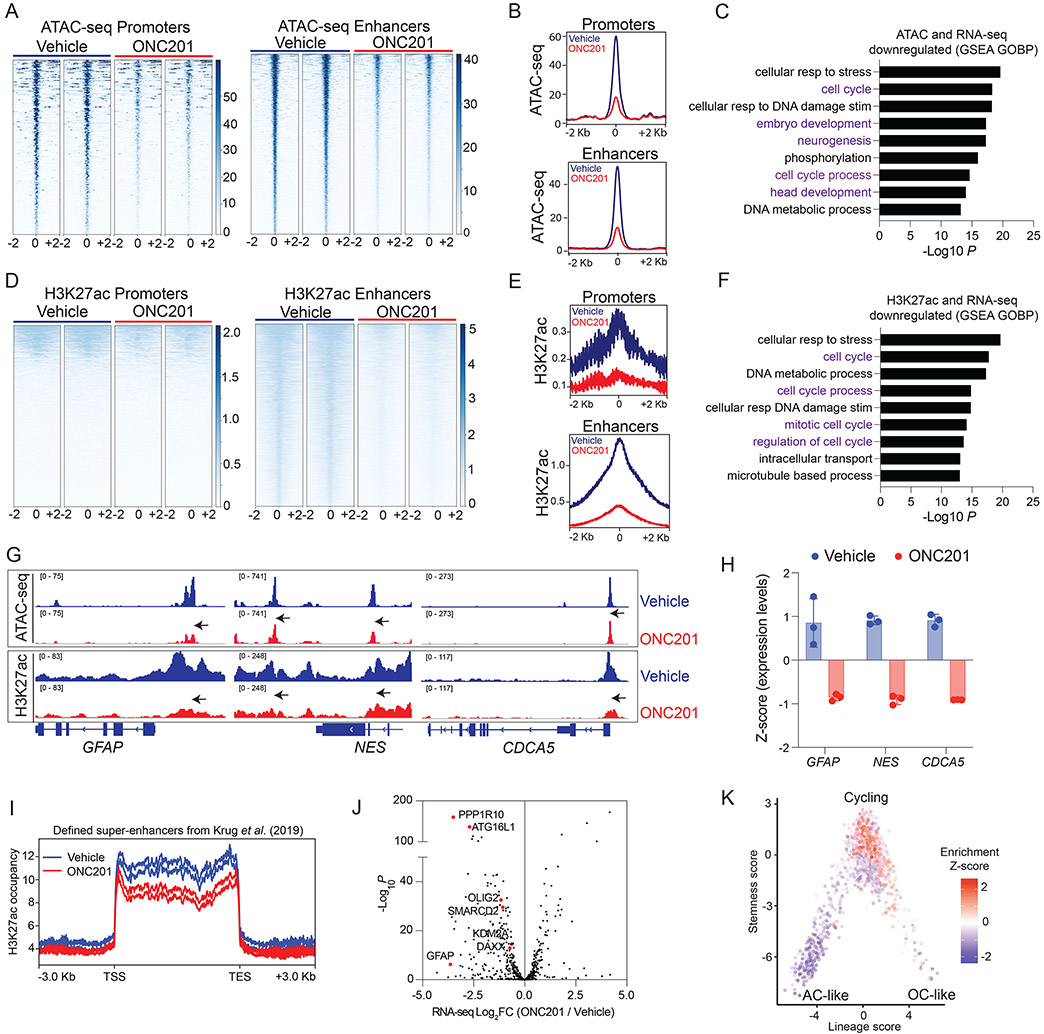
Fig. 6. ONC201 reduces chromatin accessibility at genes related to cell cycle and neuro-glial differentiation.
(A) Heatmaps showing chromatin accessibility (ATAC-seq) at promoters and enhancers (+/− 2Kb from peak center) in H3.3K27M DIPG007 cells treated with vehicle or ONC201 (5 μM ONC201 for 48 hrs, n=2, each).
(B) Overall peak representation of ATAC-seq data from Fig. 6A (ONC201=red, veh=blue).
(C) GSEA of genes with decreased chromatin accessibility (ATAC-seq) at promoters and enhancers from Fig. 6A-B.
(D) Heatmaps showing genomic H3K27ac at promoters and enhancers (+/− 2Kb from peak center) in DIPG007 cells treated with vehicle or ONC201 (5 μM ONC201 for 48 hrs, n=2, each).
(E) Overall peak representation of H3K27ac data from Fig. 6D (ONC201=red, veh=blue).
(F) GSEA of genes with decreased H3K27ac enrichment at promoters and enhancers and reduced gene expression from Fig. 6D-E.
(G) Representative ATAC-seq and H3K27ac ChIP-seq tracks from ONC201- (red) or vehicle-treated (blue) cells at GFAP, NES and CDCA5.
(H) Expression of GFAP, NES and CDCA5 in ONC201- (red) or vehicle-treated (blue) cells.
(I) H3K27ac-enriched super-enhancers defined by Krug et al. (37) in H3K27M tumors were analyzed in ONC201- (red) versus vehicle-treated (blue) H3.3K27M DIPG007 cells.
(J) Volcano plot of gene expression from RNA-seq (X-axis, Log2FC, ONC201 versus vehicle) plotted against -Log10 P (Y-axis) for genes with decreased H3K27ac-marked super-enhancers in ONC201- versus vehicle-treated cells from Fig. 6I.
(K) Plot of downregulated H3K27ac-marked genes projected on previously published single-cell RNA-seq data (50) from human H3K27M-DMG samples (n=6) as plotted stemness (Y-axis) versus lineage (X-axis) scores.

