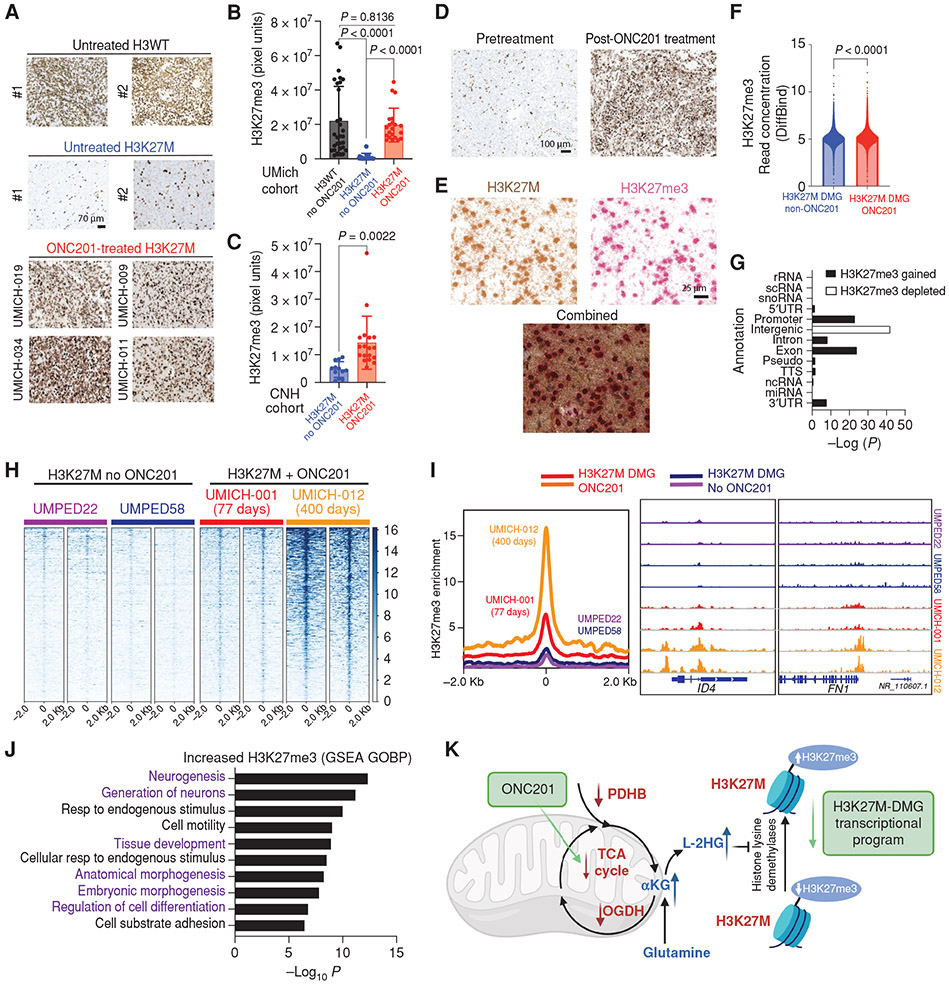
Fig. 7. ONC201 treatment increases genomic H3K27me3 in H3K27M-DMG patient tumors.
(A) Representative images of tumor samples stained for H3K27me3 from untreated H3WT, untreated H3K27M-DMGs, and ONC201-treated H3K27M-DMG patient tumor samples.
(B) Quantification of H3K27me3 (3 regions were captured in multiple tumor areas in a blinded manner/case) in H3WT non-ONC201 (n=10, black), H3K27M non-ONC201 (n=11, blue), or H3K27M ONC201-treated (n=6, red) patient samples from the University of Michigan (UMich) Cohort. Data analyzed using ANOVA.
(C) Quantification of H3K27me3 (3 regions were captured in multiple tumor areas in a blinded manner/case) in H3K27M non-ONC201 (n=4, blue) or H3K27M ONC201-treated (n=6, red) independent, non-overlapping patient samples from the Children’s National Hospital (CNH) Cohort. Data analyzed using unpaired, two-tailed, two-sided, non-parametric Mann Whitney test.
(D) Representative images of H3K27M-DMG tumor samples from the UMich cohort stained for H3K27me3 from the same patient pre-treatment (biopsy) or post-ONC201 treatment (autopsy). Data analyzed using unpaired, two-tailed, two-sided, student’s t test.
(E) Representative images from an ONC201-treated H3K27M-DMG tumor sample from the UMich cohort stained with combined immunohistochemistry for H3K27M (brown) and H3K27me3 (red). Images show brown or red chromogens or an overlay of both.
(F) Overall genome-wide H3K27me3 in ChIP-seq from H3K27M-DMG tumor samples treated with or without ONC201 treatment (n=2 patients per condition). Data analyzed using unpaired, two-tailed, two-sided, non-parametric Mann Whitney test.
(G) Comparison of genomic H3K27me3 in H3K27M-DMGs tumor samples derived from patients treated with (n=2) or without (n=2) ONC201 from Fig. 7F.
(H) Heatmaps showing genomic H3K27me3 levels (+/− 2Kb from peak center) in H3K27M-DMG tumor samples with (patients UMICH-001 and UMICH-012) or without (patients UMPED22 and UMPED58) ONC201 treatment. Each set of two heatmaps represents replicates obtained from different tumor regions for each patient.
(I) (Left) Overall peak representation of genomic H3K27me3 in ONC201-treated (UMICH-001, orange; and UMICH-012, red) and non-ONC201 H3K27M-DMGs (UMPED22, purple; and UMPED58, blue). (Right) Representative H3K27me3 tracks for genes ID4 and FN1 from each tumor sample.
(J) GSEA analysis of genes with significantly increased H3K27me3 in ONC201-treated versus untreated patients from Fig. 7F-I.
(K) Schema of overall proposed mechanism of ONC201 impact on metabolic and epigenetic signaling in H3K27M-DMGs.

