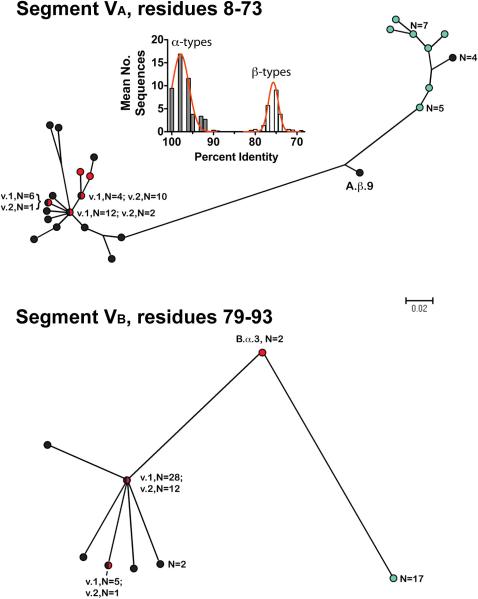
Figure 3.
Phylograms of unique fHbp amino acid sequences in modular variable segments VA (residues 8-73) and VB (residues 79-93). Segments derived from fHbp in the variant groups 1 are shown as black circles; variant 2 group as red circles, and variant 3 group as aqua circles. Where multiple proteins possessed an identical sequence in a segment, the number of proteins is given in parentheses. A.β.9 and B.α.3 refer to proteins with exceptional junctional points (See text). The scale bar indicates 2 amino acid changes per 100 residues. The histogram (Segment VA) shows the mean number of protein sequences (Y-axis) and percent amino acid identity (X-axis) generated by comparing each of the 48 α A segments to the corresponding α and β types A segments of all 70 proteins. The corresponding histograms comparing each of the α segments to the corresponding α and β types, and each of the β segments to the corresponding α and β types, for all five modular variable segments, VA-VE, are shown in supplementary Figure S1.

