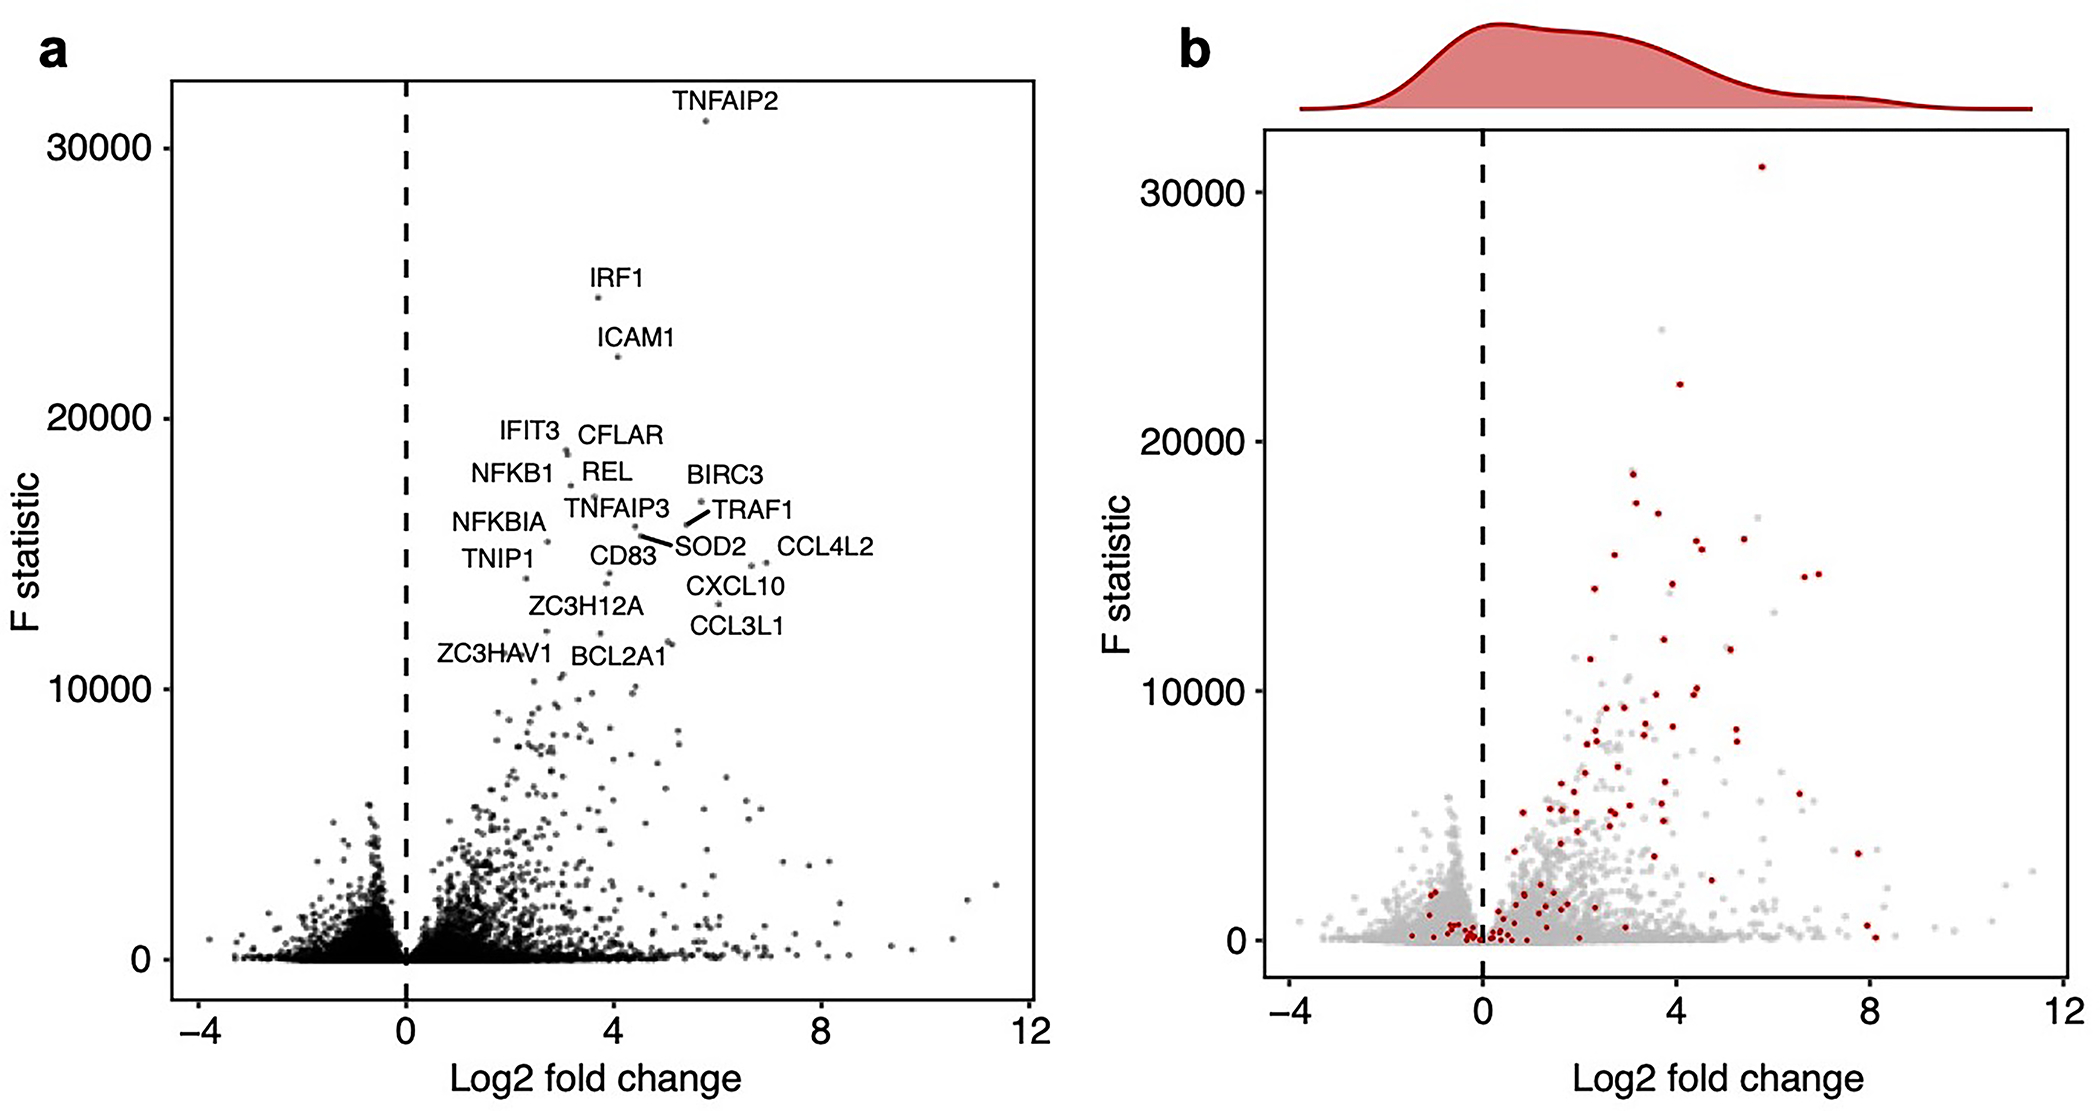
Extended Data Figure 2. Analysis of pre-stimulated cells.

Volcano plots showing the log2 fold changes (x-axis) and F statistics (y-axis) of all genes from differential expression analysis of pre-stimulated vs. LPS-stimulated cells. (a) Top 20 most significantly differentially expressed genes are labeled. (b) Same data as a, but instead the top 100 genes (based on the number of perturbations that significantly modulate them) are highlighted in red. Density plot shows the distribution of log2 fold changes of these 100 genes.
