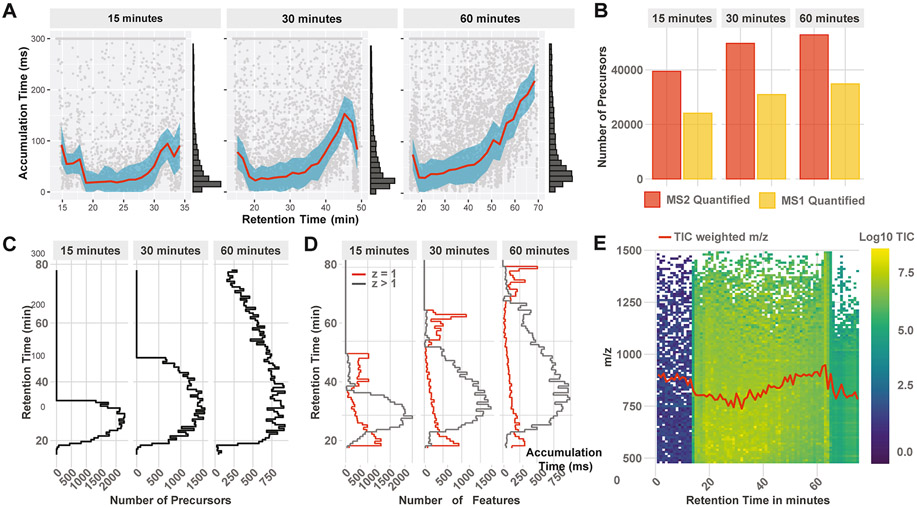
Figure 4.
Optimizing the gradient profile and length. DO-MS allows for optimizing the LC gradient of experiments based on metrics, capturing the whole LC–MS workflow. (A) Distribution of MS1 accumulation times across the LC gradient. (B) Number of quantified precursors in relation to the gradient length. (C) Number of identified precursors by the search engine across the gradients and (D) ion features identified by Dinosaur. (E) Ion map displaying the TIC and mean m/z (red curve) as a function of the retention time. All data are from 100× 3-plexDIA samples as described in the methods.

