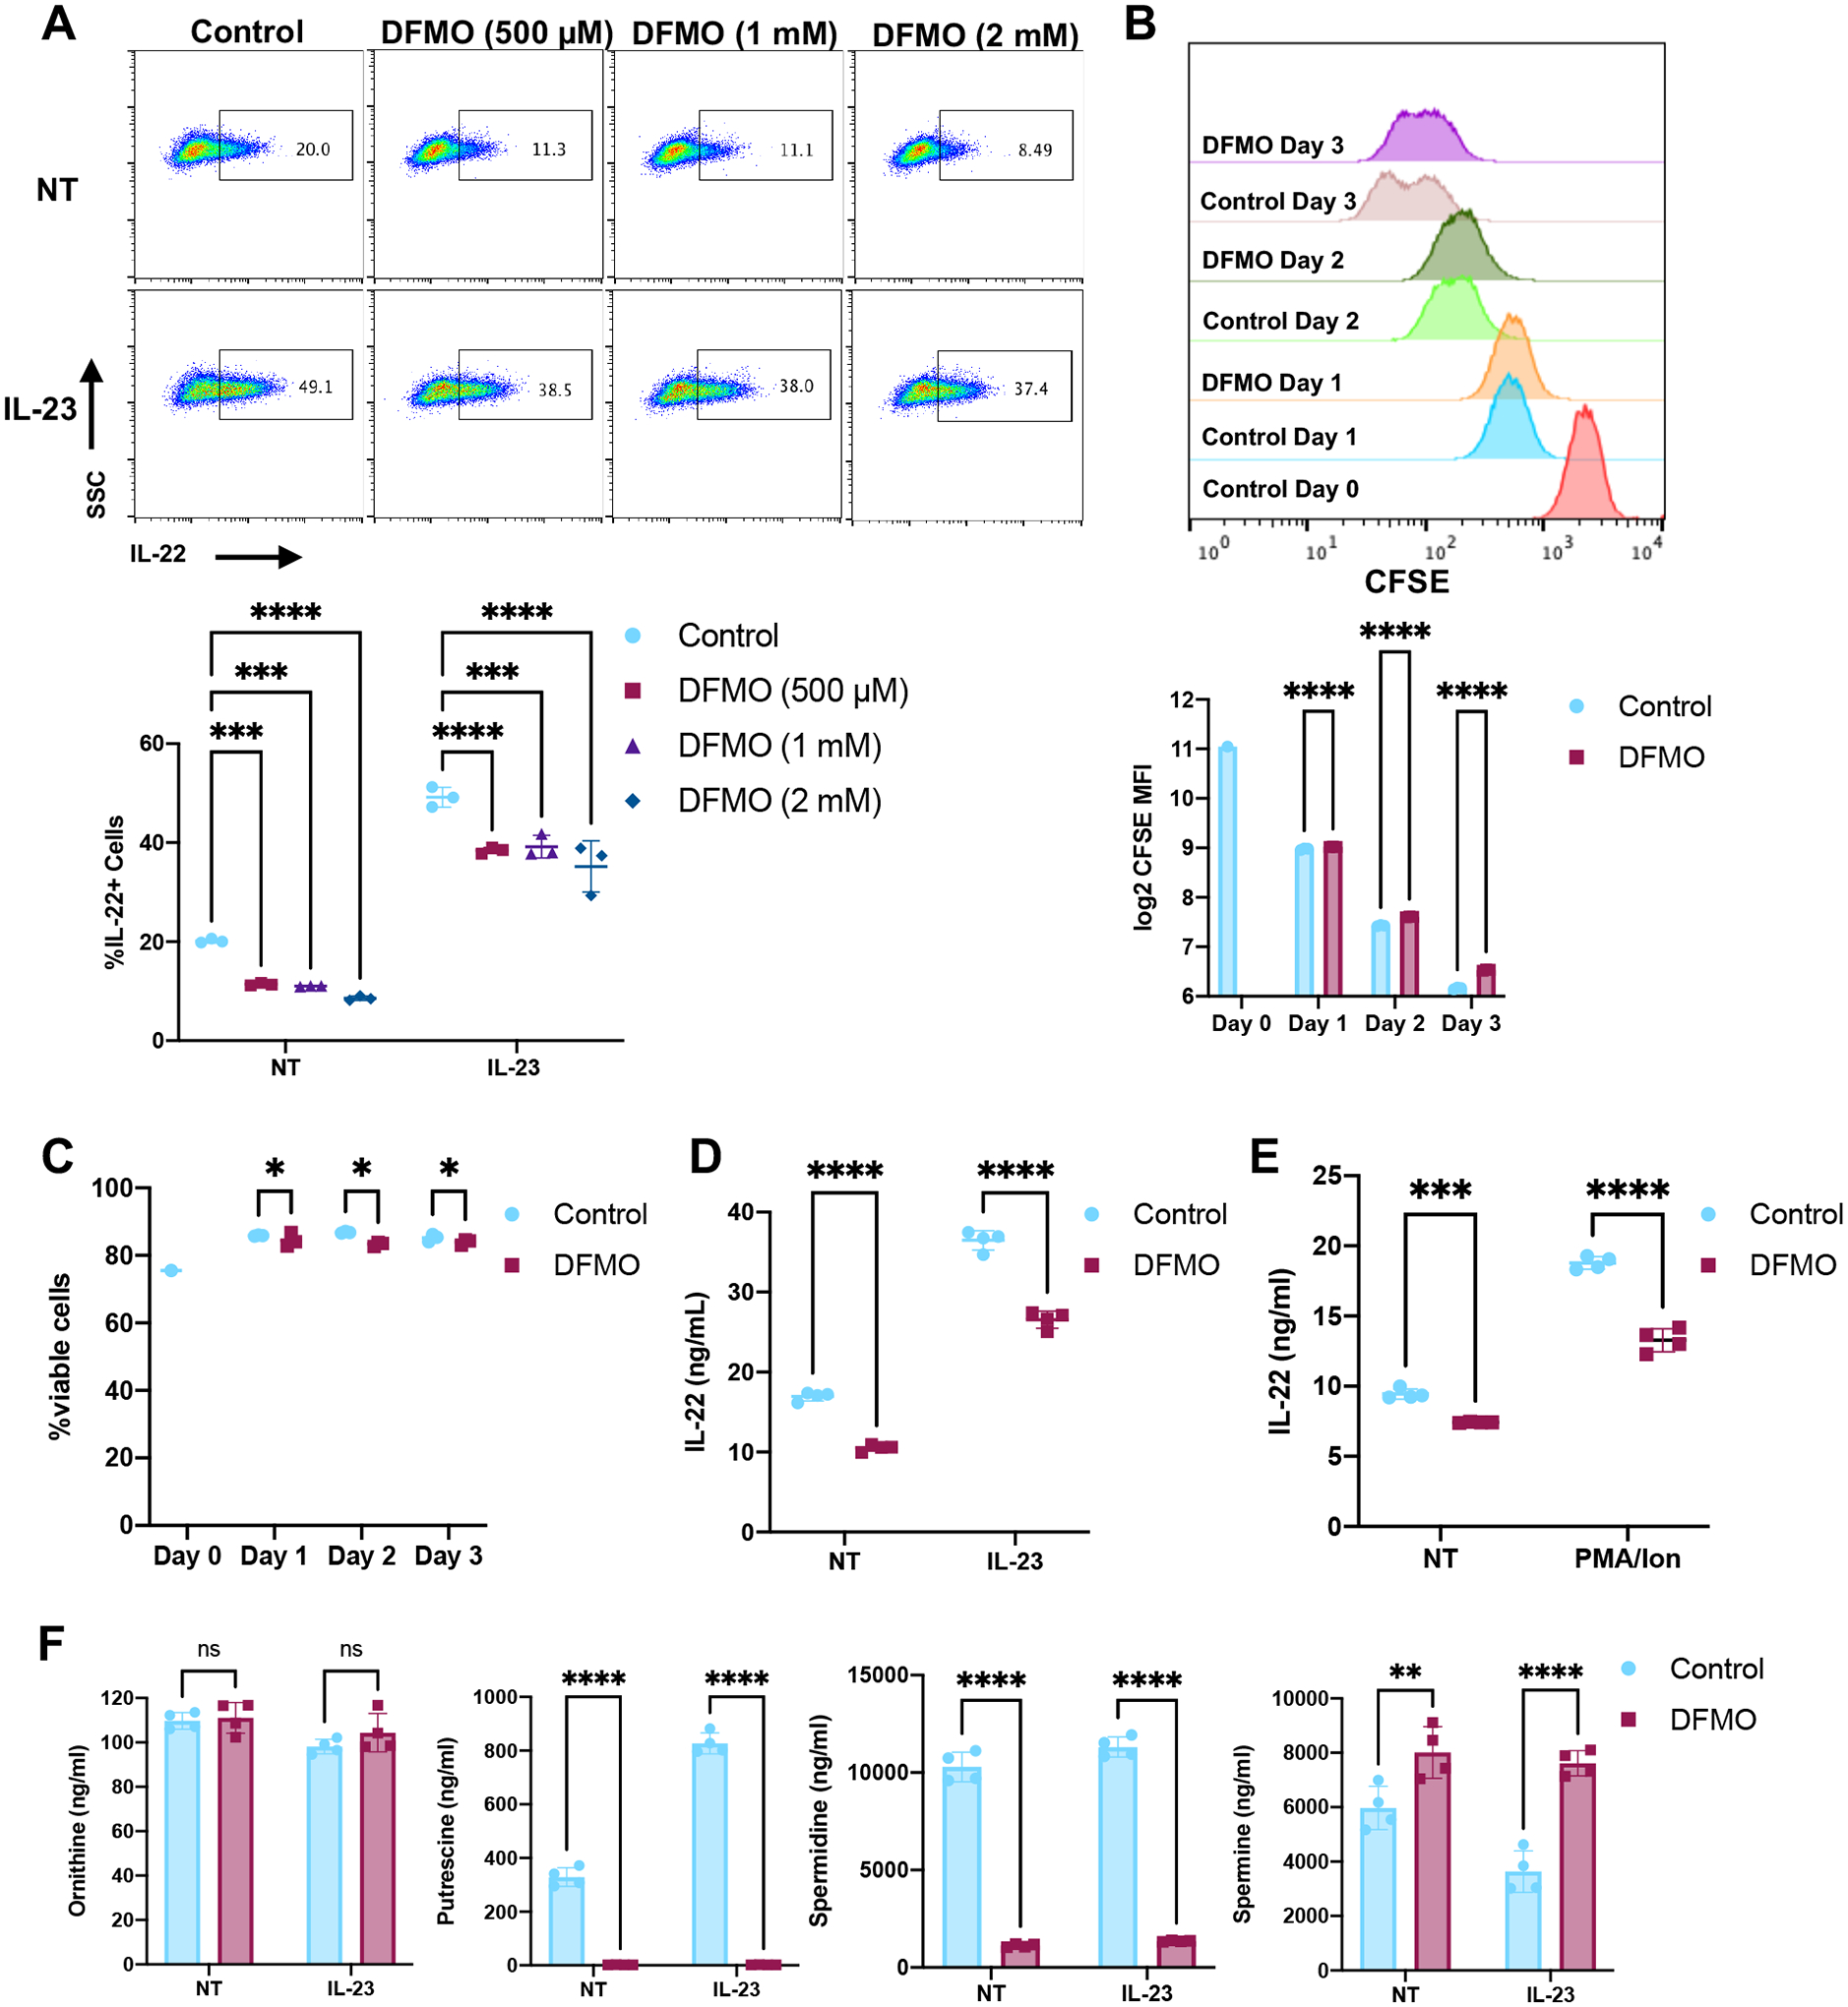
Figure 3. Inhibition of polyamine biosynthesis reduces ILC3 activation.

(A) MNK-3 cells grown with the indicated concentration of DFMO were stimulated with IL-23 or not (NT) for 5 hours in the presence of BFA and then analyzed by ICS and FACS. Shown are representative FACS plots and summary data. Each point represents one well, line indicates mean, n=3. Data are representative of two independent experiments. p<0.001 (***), p<0.0001 (****). (B-C) CFSE labelled MNK-3 cells were grown in the presence or absence of 500 μM DFMO over 3 days. Each day, cells were analyzed for CFSE and viability staining by FACS. Shown are (B) representative histogram plots and CFSE mean fluorescence intensity (MFI) and (C) viability data. Each point represents one well, line indicates mean, n=3. Data are representative of three independent experiments. p≤0.05 (*), p<0.0001 (****). (D-E) MNK-3 cells grown with or without 500 μM DFMO were stimulated with IL-23 or 5 μg/ml PMA and 0.5 μg/ml ionomycin or untreated (NT) for 18 hours. IL-22 was quantitated in the supernatants by ELISA. Each point represents one well, line indicates mean, n=4. Data are representative of three independent experiments. p<0.001 (***), p<0.0001 (****). (F) MNK-3 cells grown with or without 500 μM DFMO were stimulated with IL-23 or without (NT) for 18 hours and cells were subjected to metabolomics analysis by HPLC-MS. Each point represents one well, bar indicates mean, n=4. p<0.01 (**), p<0.0001 (****). Differences that were not significant (p>0.05) are marked as ns.
