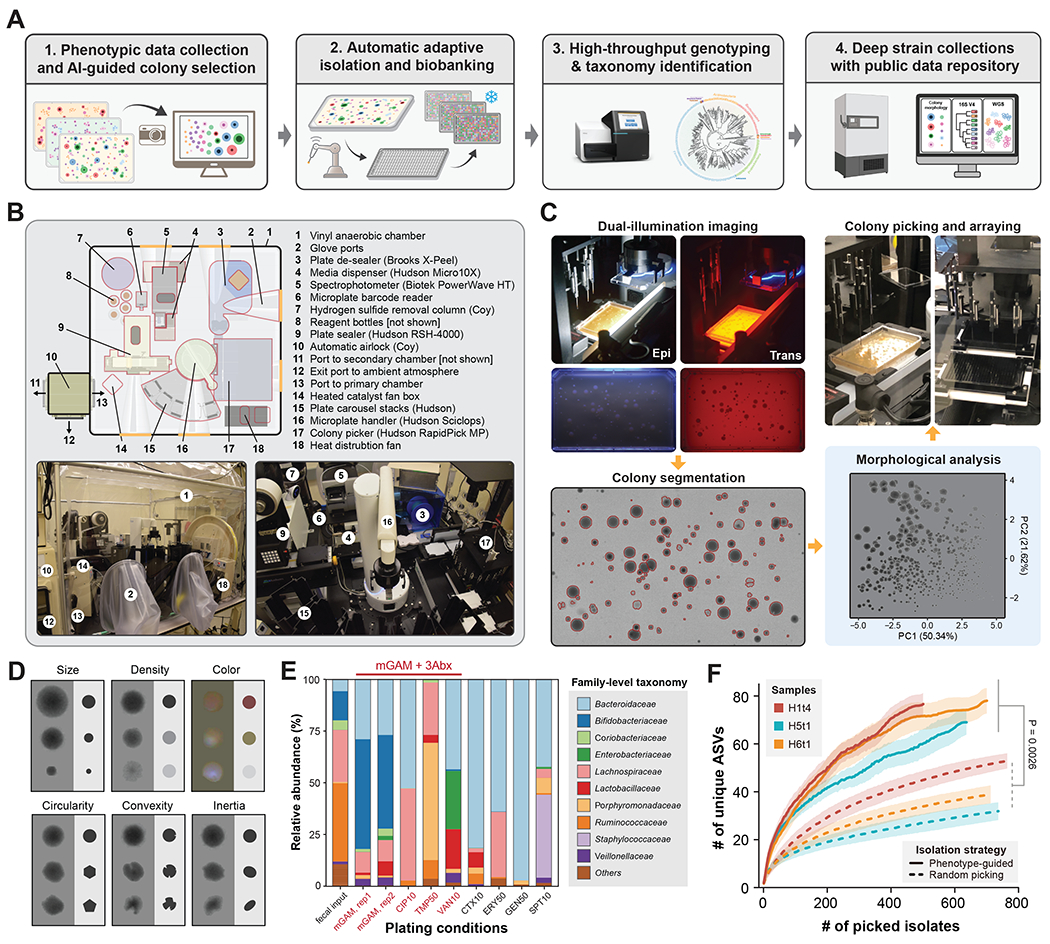
Figure 1. A data-driven microbial isolation strategy using phenotypic and morphologic features.

(A) Framework of phenotype and morphology-driven strain isolation and data collection of the human gut microbiome. Human fecal samples were plated and cultured under different antibiotics selection and morphologically diverse colonies were then isolated, biobanked and analyzed by downstream sequencing.
(B) Setup of the automated anaerobic microbial isolation and cultivation system CAMII.
(C) Illustration of morphology-guided colony isolation on CAMII. Colonies grown on plates are imaged under trans- and epi-illumination and subjected to contour segmentation and morphologic features extraction. Data are analyzed by PCA to identify the set of most morphologically diverse colonies that are then isolated by an integrated colony picker.
(D) Illustration of diverse colony morphology on plates. Colony size and shape features were extracted from trans-illuminated images and colony color features were extracted from epi-illuminated images.
(E) Fecal sample H1t1 were cultured with seven different antibiotics to evaluate their capacity to yield the most unique and diverse bacteria by 16S analysis at the family level. Ciprofloxacin, Trimethoprim and Vancomycin were selected for subsequent colony isolations.
(F) Number of unique ASVs obtained from phenotype-guided isolation compared to random isolation of three human fecal samples H1t4, H5t1 and H6t1. Isolation was performed by CAMII; Random isolation was performed on a random subset of all detected colonies on the plates and phenotype-guided isolation was performed on morphology-selected colonies by the algorithm (Figure S1B). P-value is calculated by a two-sided paired t-test on area under the curve. Ribbons on the curves represent the standard deviations of the number of obtained unique ASVs by the algorithm.
