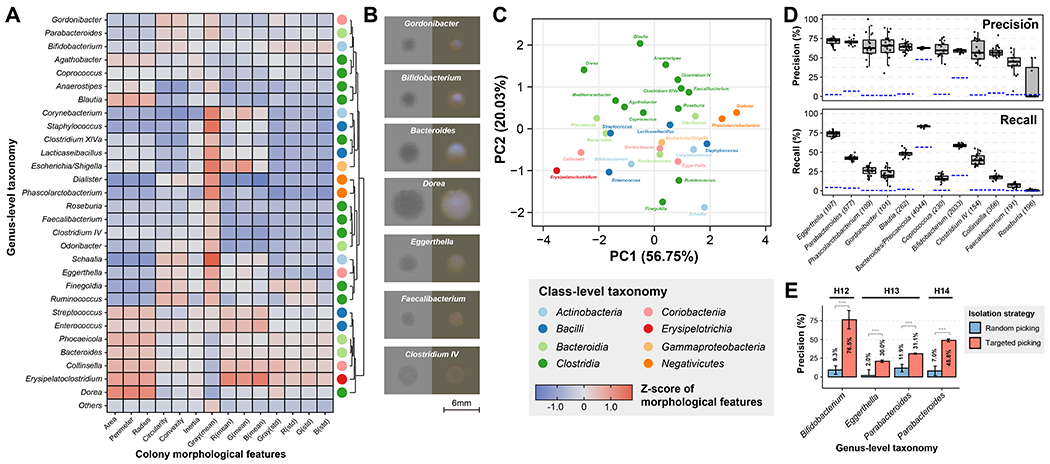
Figure 3. Using colony morphology to predict taxonomic identity enhances targeted isolation.

(A) Heatmap of average Z-scores of morphological features across different bacterial genera. Different genera exhibiting diverse morphological patterns were classified into different groups by hierarchical clustering and the colored dot on the right represents their class-level taxonomy.
(B) Examples of colony images. Trans-illuminated images are on the left side and epi-illuminated images are on the right side.
(C) PCA ordination of genera based on their colony morphological features. Colors indicate class-level taxonomy.
(D) Performance of bacterial genus prediction based on morphological features by a random forest classifer. The numbers in brackets represent the number of isolates for each genus. Model training and evaluation was bootstrapped 20 times and the box plots show the variance of performance (N = 20). Blue line represents the performance of null model. Definition of box-plot elements: center line: median; box limits: upper and lower 25th quartiles; whiskers: 1.5x interquartile range.
(E) Performance of model-based targeted isolation. Bars represent the mean of prediction precision by individual-specific models that were bootstrapped 20 times and error bars represent the standard deviations. P-values were calculated by two-sided Student’s t-test on precisions from N = 20 randomly initialized model bootstrapping.
