
Figure 4. Mapping interaction between gut microbiota by colony morphology analysis.
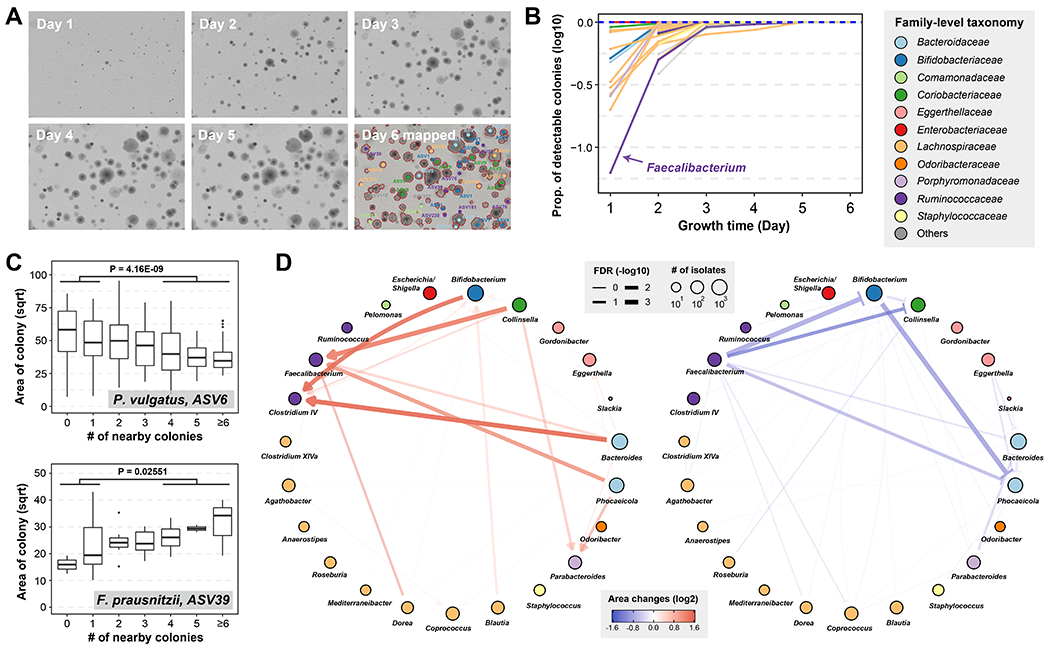
(A) Images of an example plate during 6 days of growth and colony identities on the plate by 16S sequencing.
(B) Proportion of detectable colonies at different time points compared to day-6 for each genus. Colors indicate the family-level taxonomy.
(C) Correlation of colony size and number of nearby colonies for two representative ASVs. A full list of correlations is provided in Table S8. P-values are calculated by one-sided Mann–Whitney U test on area of colonies with no more than 1 nearby colonies or no less than 4 nearby colonies (N = 101 vs. 82 for ASV-6 and 17 vs. 9 for ASV-39). Definition of box-plot elements: center line: median; box limits: upper and lower 25th quartiles; whiskers: 1.5x interquartile range.
(D) Pairwise growth promoting and inhibiting networks between genera. Directional growth promoting effects are shown in red sharp arrow and directional growth inhibiting effects are shown in blue blunt arrows. Nodes represent bacterial genera and are colored by family. Node sizes are proportional to the number of isolates used in this analysis and edges widths are proportional to the significance of the interactions.