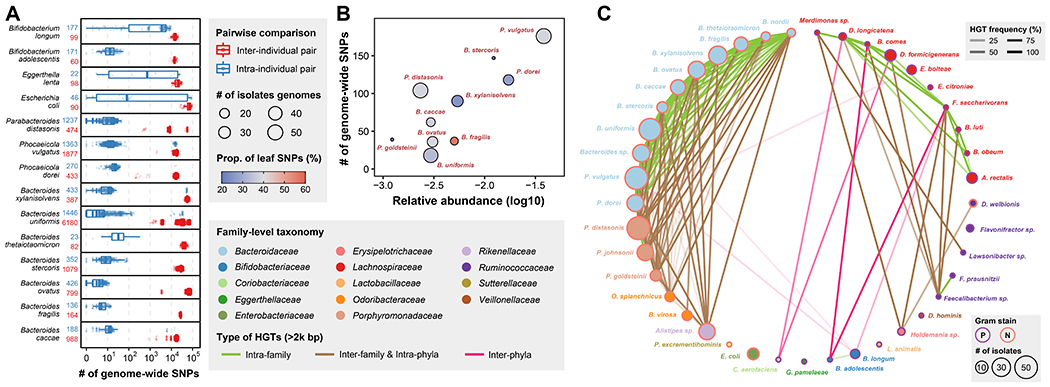
Figure 5. Strain-level genomic diversity of the gut microbiome within and between individuals.

(A) Number of genome-wide SNPs between isolates from the same or different individuals for 14 isolates-rich species. The numbers after the species name represent the number of inter-individual (red) and intra-individual (blue) pairs. Definition of box-plot elements: center line: median; box limits: upper and lower 25th quartiles; whiskers: 1.5x interquartile range.
(B) Correlation between number of genome-wide SNPs and relative abundance in original fecal sample for isolates-rich species in individual H1. The size of dot represents number of isolates used in this analysis and the color represents proportion of SNPs present in only 1 genotype.
(C) Network of 2kb+ HGT frequency based on 409 isolates from H1. Nodes represent bacterial species and are colored by family. Node sizes are proportional to the number of isolates in the H1 collection and edges opacity are proportional to the HGT frequency between the two connected species. Edge color represents different types of HGT, i.e., inter-phyla, intra-phyla & inter-family, or intra-family HGT and node outline color represents gram staining of the species.
