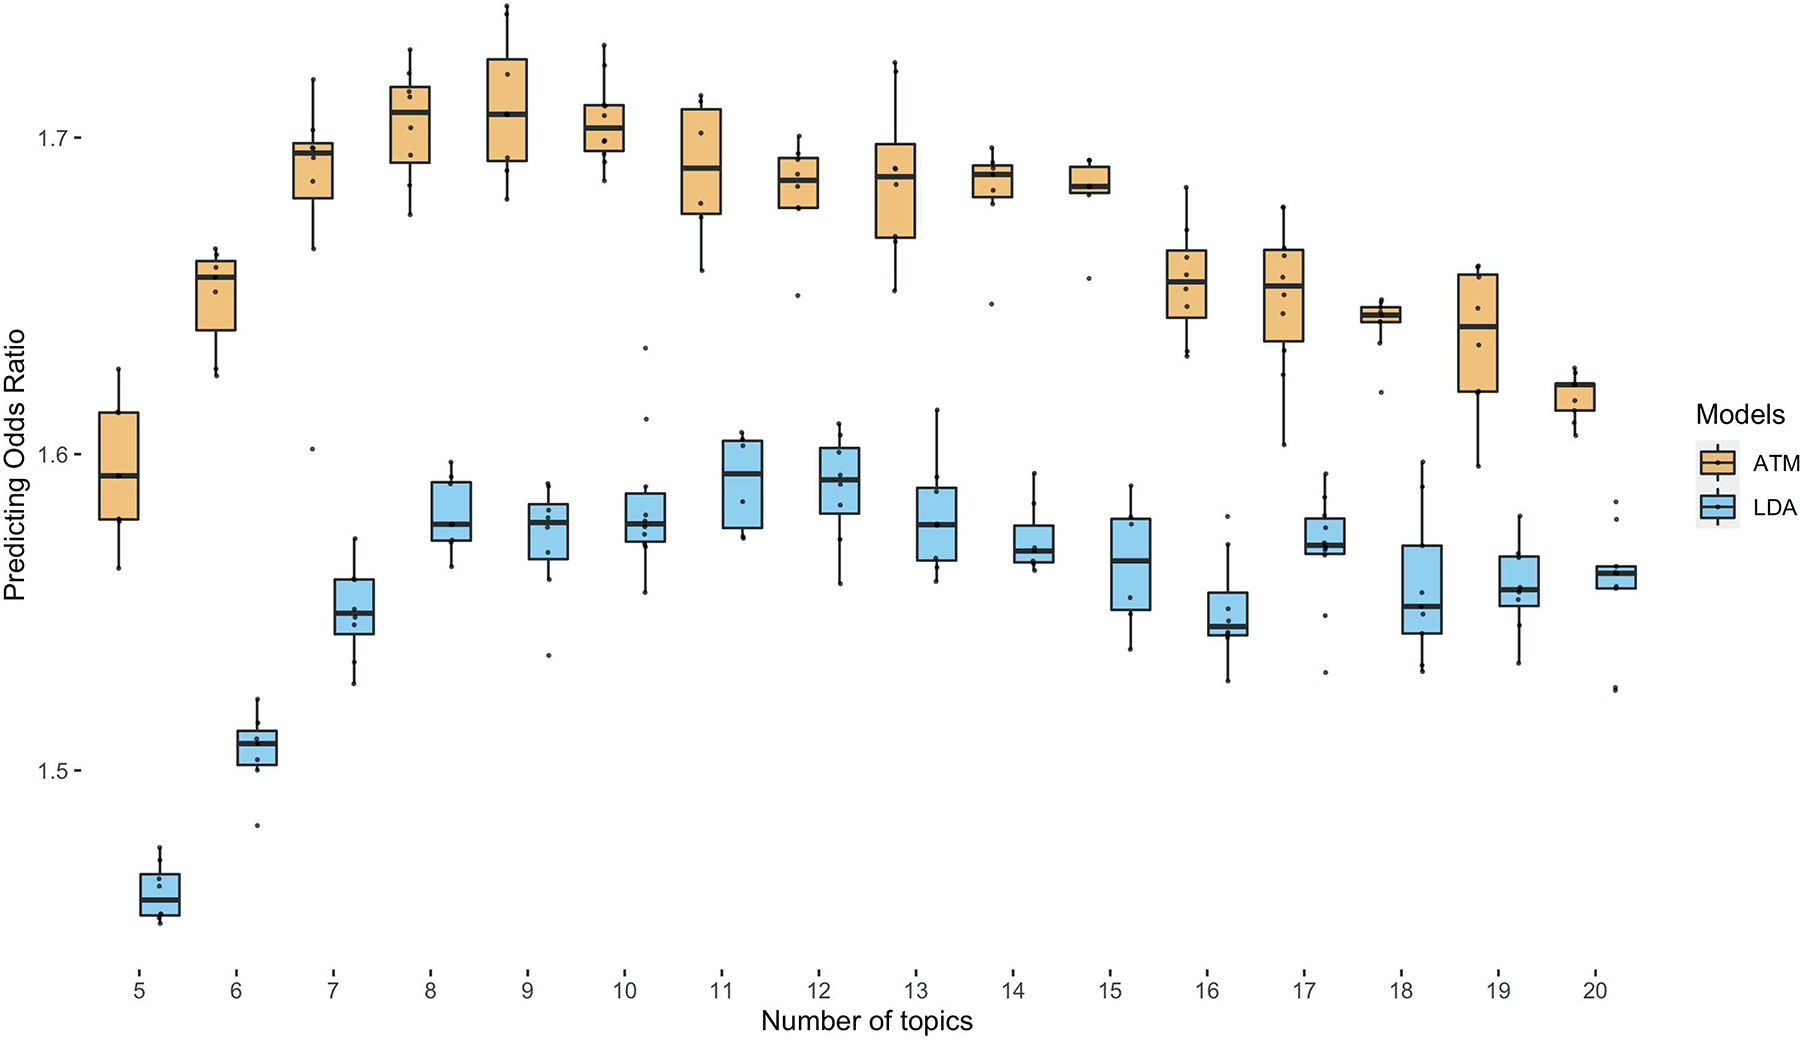
Extended Data Fig. 3. Comparison of prediction odds ratio between LDA and ATM.

Each dot represents results from running either ATM or LDA on the same random training and testing split. The models were run with different topic numbers and we chose a cubic spline with one knot for configuring ATM topic loadings. The prediction odds ratios are computed on the testing data using topic loadings inferred from the training data and topic weights inferred using previous diseases of testing individuals. The odds ratios are between the odds that target diseases are within model-predicted top percentile disease set versus the odds that target diseases are within the prevalence-ordered top percentile disease set. For the optimal model with 10 topics, ATM has an average prediction odds ratio 1.71 (across 10 random training-testing splits); LDA has an average prediction odds ratio 1.58 (across 10 random training-testing splits). Box plots show the distributions of the dots; centre, box bounds, and whisker ends denote median, quartiles, and minima/maxima.
