
Extended Data Fig. 6. Excess PRS analysis for all topics across 10 diseases (selected by heritability z-score).
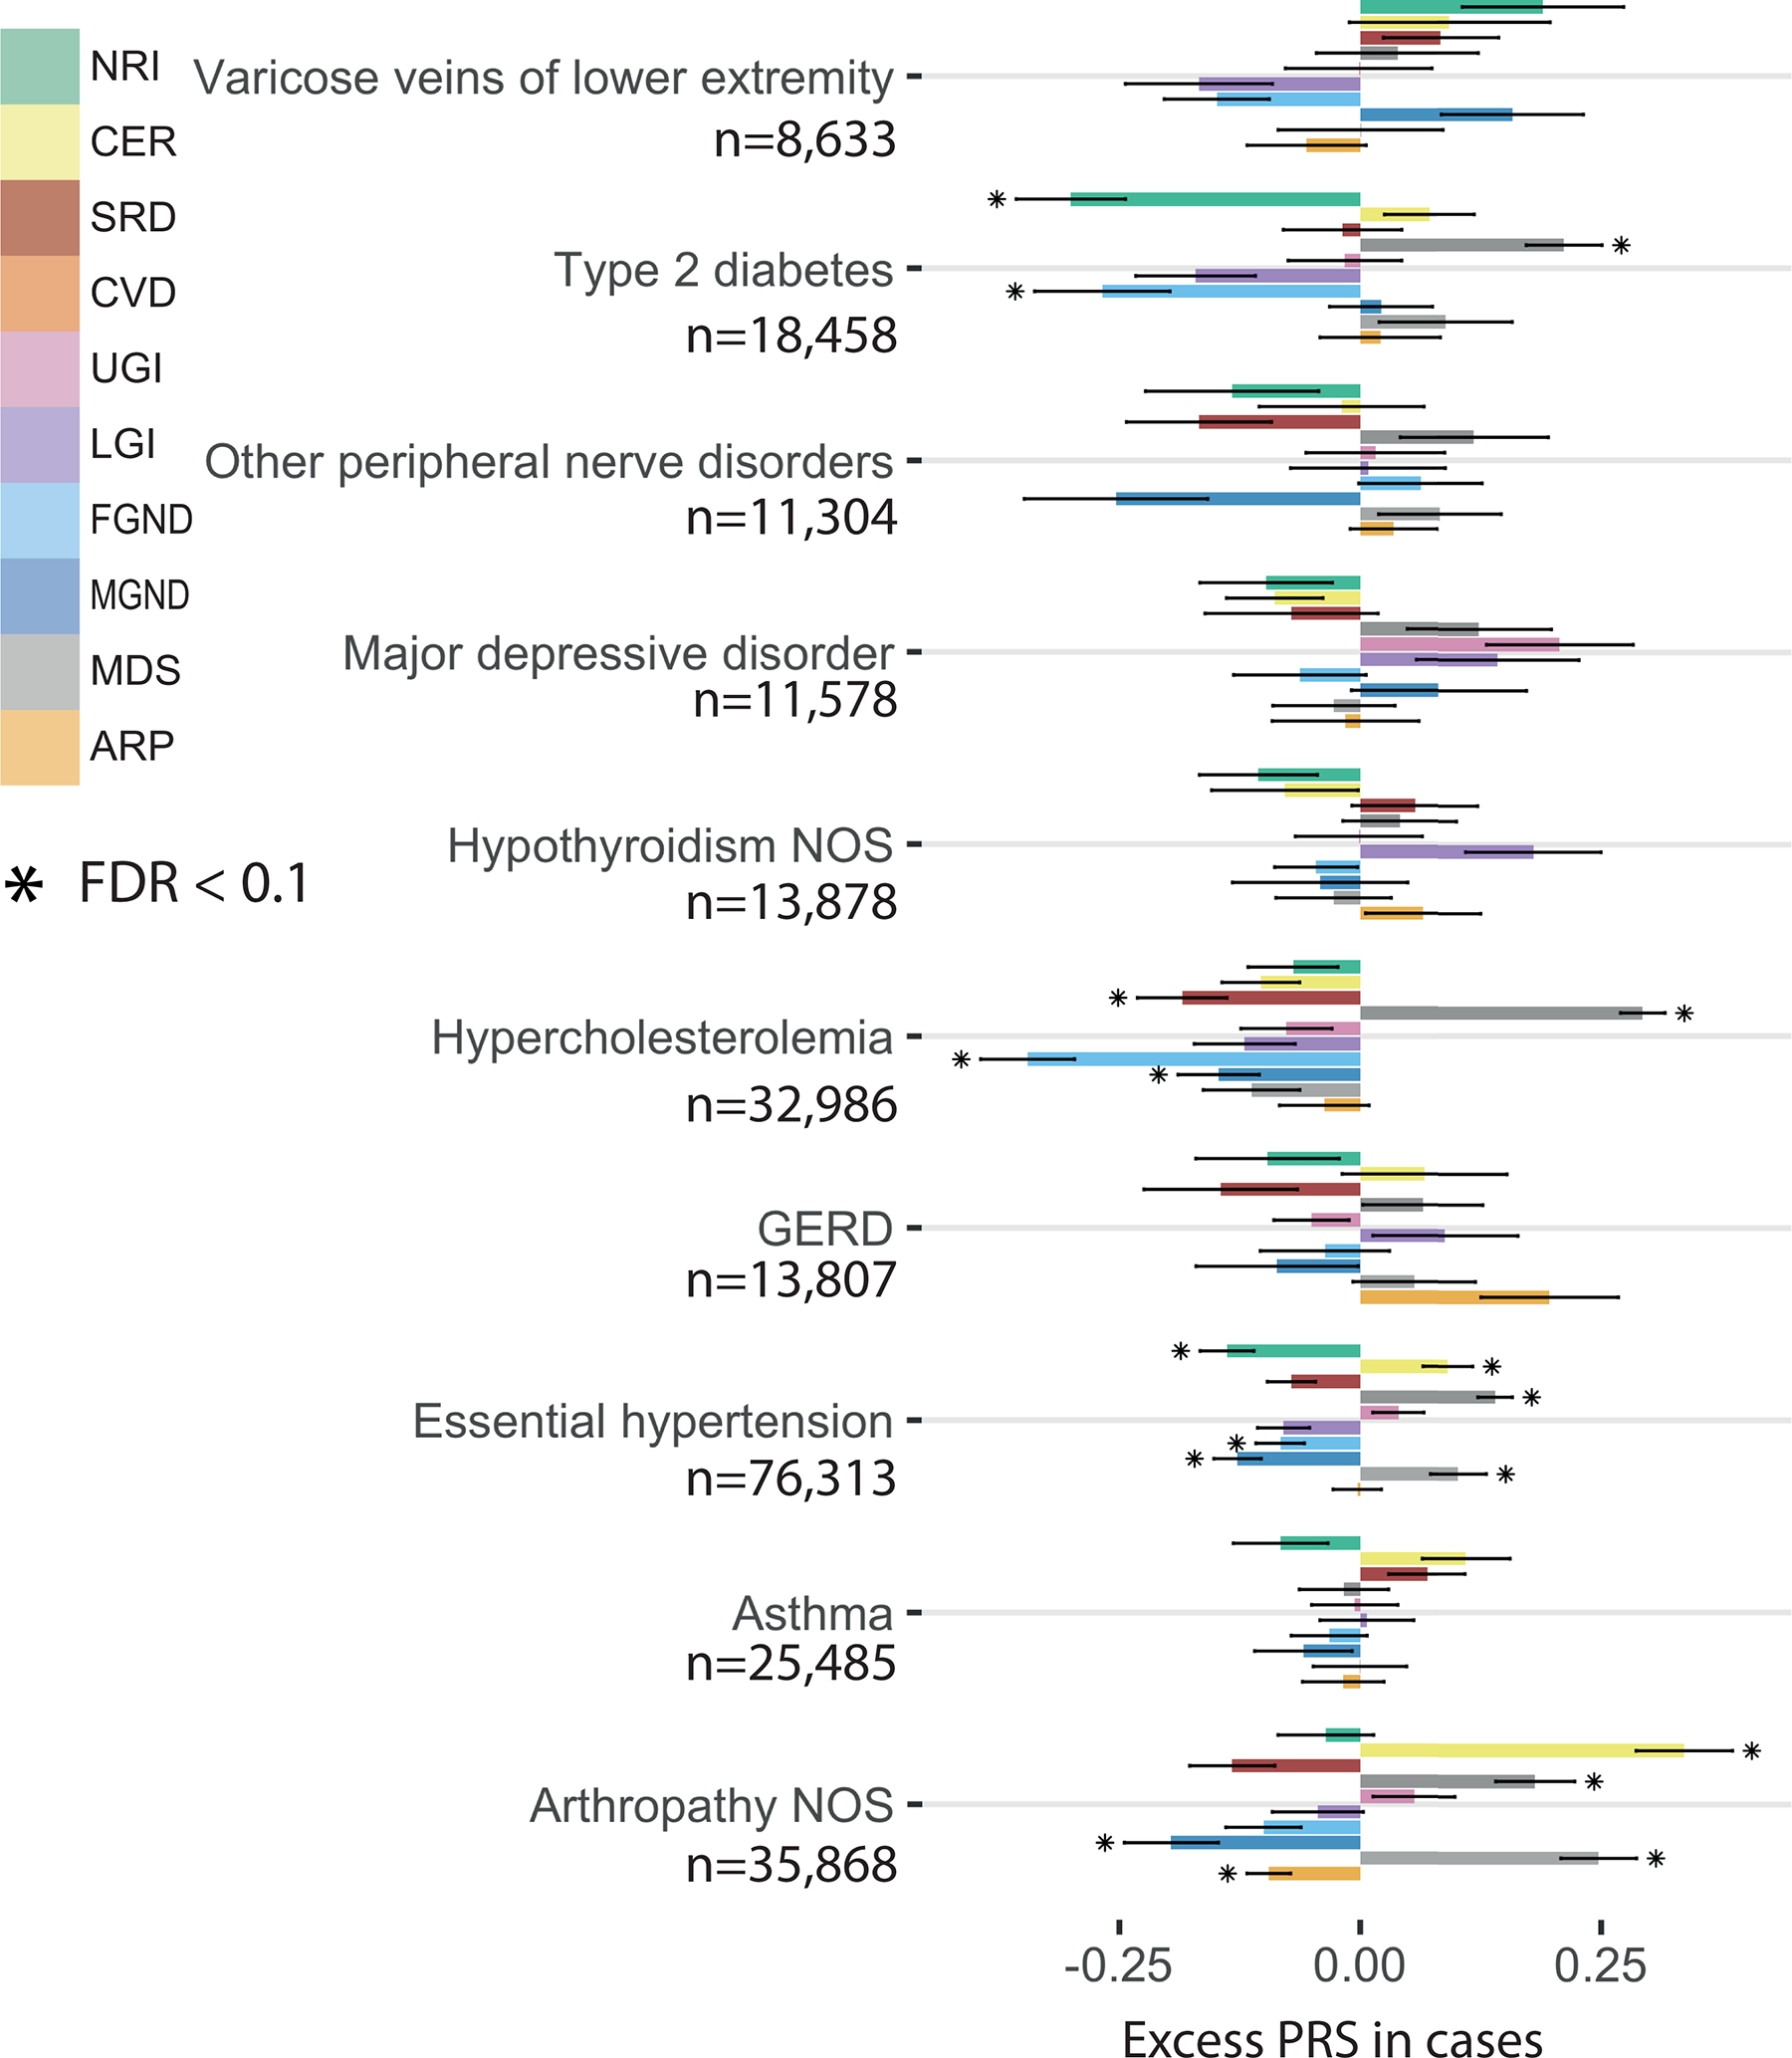
The bar plot shows the estimated changes in s.d. of PRS per unit changes in the patient topic weight in disease cases. The PRS is estimated using all the cases in British Isle Ancestry. Error bars denote the 95% confidence interval. The stars show disease-topic pairs that are significant at FDR = 0.05. Numerical results are reported in Supplementary Table 13.